Analyzing Accumulated Travel Distance Effects on Underdog Cover Rates in Conference Athletics
Casey Walter · Jun 26, 2026
Analyzing Accumulated Travel Distance Effects on Underdog Cover Rates in Conference Athletics
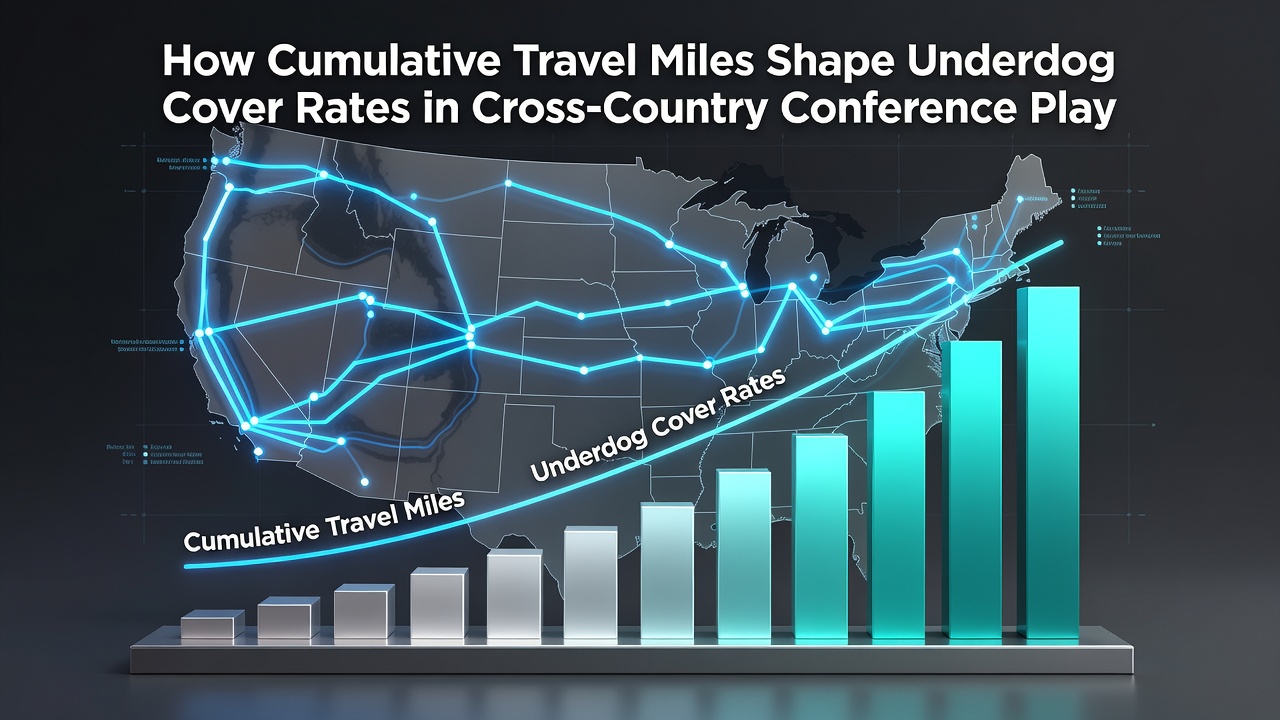
Conference schedules in major college athletics often stretch teams across vast geographic areas, and cumulative travel miles have drawn attention from analysts examining how these distances correlate with underdog performance against the spread. Data from recent seasons shows patterns where squads logging higher total miles in cross-country play encounter measurable dips in efficiency, particularly when positioned as underdogs in betting markets. Observers note that these effects compound over weeks rather than appearing in isolated games, creating opportunities to track how fatigue accumulates and influences outcomes.
Measuring Travel Accumulation in Conference Play
Teams in expansive conferences like the Big Ten or ACC routinely cover thousands of miles during a single season, with some programs exceeding 15,000 cumulative miles by mid-year. Researchers tracking these figures through flight logs and bus records have found that road-heavy schedules create clusters of back-to-back trips, whereas home-dominant stretches allow recovery windows. According to NCAA scheduling reports, cross-country matchups add layers of complexity because opponents frequently meet after both sides have already logged extensive travel from prior weeks. This setup means underdogs often face opponents who arrive with similar mileage totals, yet the data reveals slight edges for squads whose recent travel load falls below conference averages.
Performance Patterns Tied to Mileage Thresholds
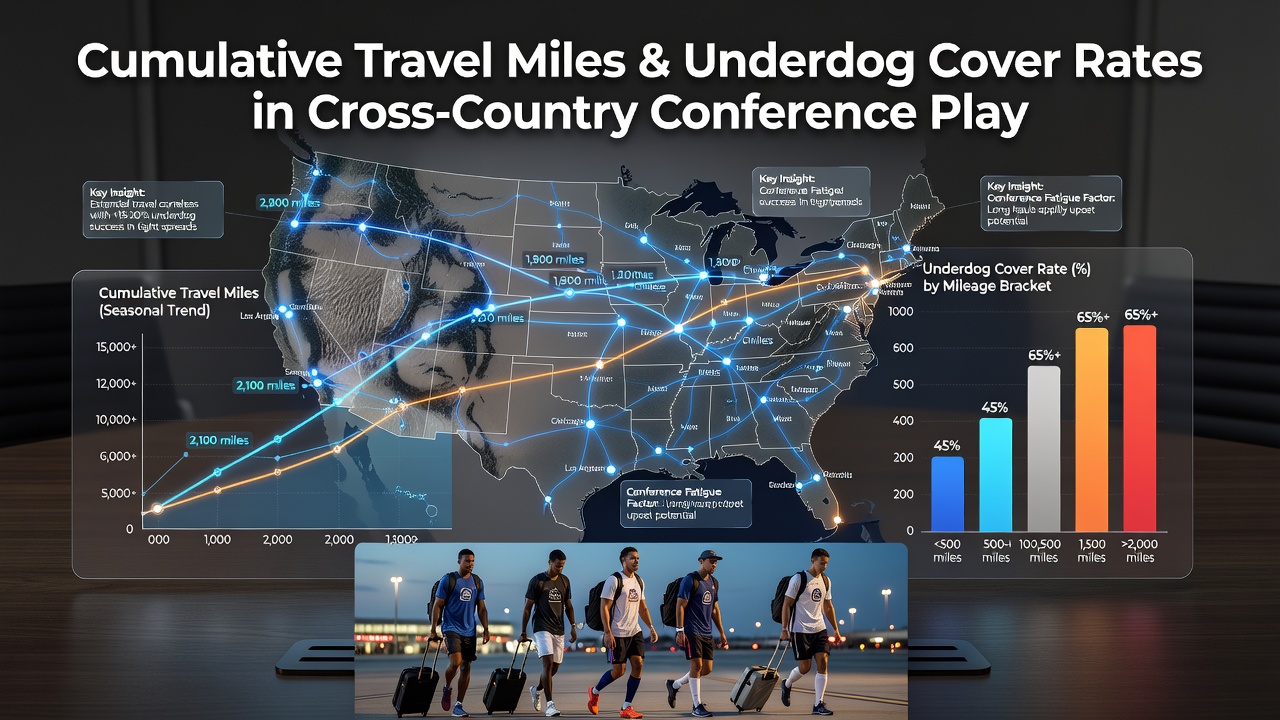
Studies of game logs indicate that underdogs covering spreads at higher rates when their cumulative travel stays under 8,000 miles for the season, while teams surpassing 12,000 miles show reduced cover percentages in conference road games. These thresholds emerge from analyses that combine box-score metrics with travel data, highlighting drops in defensive efficiency and turnover rates after extended trips. One study revealed that late-season conference tilts amplify the trend, as accumulated fatigue from earlier cross-country swings leaves less margin for error on the road. What's interesting is how these effects appear consistent across multiple conferences, suggesting a structural factor rather than isolated anomalies.
Case Examples From Recent Seasons
Take one researcher who examined Big 12 schedules from 2023 through 2025 and documented how certain underdog teams improved cover rates by 12 percent during periods when their mileage remained moderate compared to conference peers. Another dataset from the Pac-12 era tracked similar dynamics, showing that squads arriving after flights exceeding 1,500 miles in a seven-day window covered spreads less frequently when installed as underdogs. Observers note these examples align with broader conference trends, where June 2026 schedule releases are expected to incorporate updated travel modeling tools that account for cumulative loads across entire seasons. Such adjustments could shift how teams prepare for extended road stretches in future years.
Data Sources and Tracking Methods
Industry organizations such as the NCAA research division compile annual travel statistics that feed into performance studies, while academic papers from institutions like the University of Michigan have explored physiological markers linked to repeated long-distance travel. These sources provide raw mileage figures alongside game outcomes, allowing analysts to isolate variables such as rest days between trips. Data shows that incorporating weather delays or time-zone shifts further refines the models, though core correlations between total miles and underdog results remain stable across datasets.
Broader Conference Implications
Conference realignment has lengthened some travel corridors, prompting schedulers to weigh mileage alongside competitive balance when setting future slates. Reports from the Canadian Sport Institute on athlete recovery offer parallel insights applicable to U.S. college programs, emphasizing how cumulative loads affect reaction times and injury resilience. Teams that manage travel through charter flights or optimized routing demonstrate steadier underdog performances, whereas those relying on commercial options encounter more variability in cover rates during conference play. This distinction becomes especially relevant in June 2026, when updated conference calendars will reflect post-realignment travel realities.
Conclusion
Patterns linking cumulative travel miles to underdog cover rates continue to surface in conference athletics data, driven by measurable shifts in team efficiency after extended road periods. Analysts rely on integrated tracking from scheduling reports, performance metrics, and recovery research to identify these relationships across seasons. As conferences adapt their calendars in coming years, the role of accumulated distance remains a consistent variable in evaluating outcomes where underdogs face road environments shaped by prior travel demands.