Athletic Travel Patterns and Their Influence on Sports Betting Strategies
Morgan Keller · Jun 12, 2026

Athletic Travel Patterns and Their Influence on Sports Betting Strategies
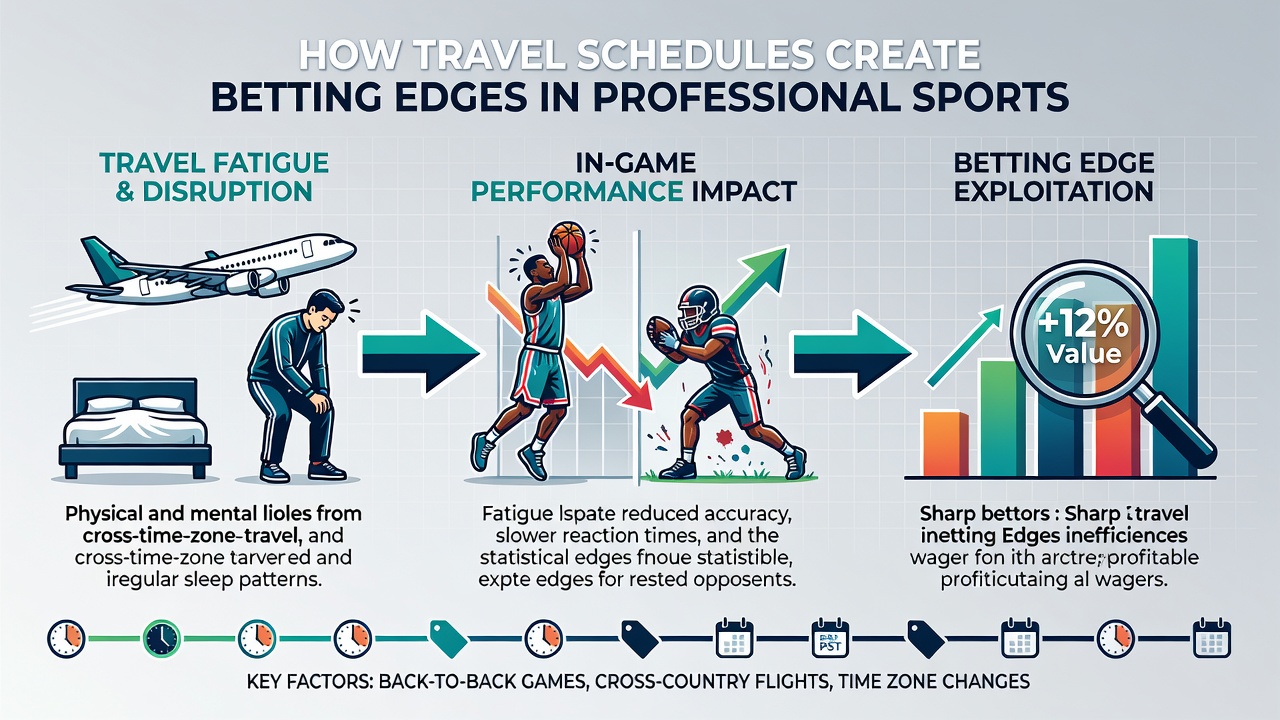
Travel schedules introduce measurable variables into professional sports performance that betting markets often price imperfectly, creating opportunities for those who track patterns in rest, recovery, and adaptation across leagues like the NBA, MLB, and NHL. Teams crossing multiple time zones face circadian disruptions that data shows reduce shooting accuracy, reaction times, and overall win probabilities, while back-to-back games compound fatigue when travel distances exceed certain thresholds.
Time Zone Shifts and Performance Metrics
Researchers have documented consistent drops in team efficiency following eastward or westward flights that span three or more zones, with studies tracking box scores from multiple seasons revealing lower points per possession in the first 48 hours after arrival. West Coast teams visiting Eastern venues encounter compressed preparation windows, whereas the reverse direction allows slightly better alignment with natural sleep cycles; analysts compile these directional effects into databases that flag mismatches between public perception and actual historical results. In June 2026, several MLB clubs will undertake extended interleague trips that cross the continent multiple times within a single month, a pattern that historically correlates with elevated run totals in day games following overnight flights.
Back-to-Back Games and Recovery Windows
Consecutive contests with minimal rest separate winning percentages sharply when one squad arrives via short-hop flights while the opponent benefits from a full day off at home, and betting lines adjust more slowly than the underlying fatigue data would suggest. Observers note that NBA teams playing the second half of a back-to-back after crossing two time zones post a win rate approximately 8-12 percent below their season average, a figure derived from league-wide tracking systems that include travel logs and player availability reports. NHL schedules add another layer because compressed playoff travel between distant cities amplifies these effects during series that shift venues every other night.
Distance, Altitude, and Venue-Specific Factors
Long-haul flights exceeding 2,000 miles correlate with measurable declines in power metrics for baseball hitters and pitchers alike, while elevation changes at venues like Denver introduce additional physiological stress that visiting clubs must manage without equivalent acclimation time. Data from multiple seasons indicates that teams arriving the same day as a game at altitude post lower on-base percentages in the opening innings, a trend that sharpens when combined with prior-day travel. Bettors who integrate flight duration records with venue altitude databases identify lines where the market has not fully incorporated these layered disadvantages.
League Schedule Construction and Market Reactions
League offices release schedules months in advance, yet the cumulative impact of clustered away trips surfaces only after teams execute them, allowing prepared analysts to project performance dips before oddsmakers fully recalibrate totals and spreads. A study conducted through the Australian Institute of Sport examined transcontinental travel effects across summer leagues and found that recovery protocols such as scheduled sleep timing and light exposure can mitigate but not eliminate performance gaps when rest periods fall below 36 hours. Those who cross-reference team travel itineraries with injury reports and recent game logs locate edges in totals markets where public bettors overweight recent form without accounting for hidden fatigue accumulation.
International and Summer Competition Travel
Events scheduled for June 2026 will require clubs to manage additional international flights ahead of domestic seasons, introducing variables such as passport delays, equipment transport issues, and varying hotel quality that compound standard jet-lag effects. European basketball teams traveling to North American summer showcases demonstrate similar directional performance patterns, and records from those exhibitions provide supplementary data points for model builders. Regulatory bodies in Canada and Australia have published aggregated travel statistics that confirm consistent drops in away-team efficiency when recovery windows compress below league norms.
Conclusion
Travel schedules generate quantifiable edges because markets react to visible statistics while underweighting the hidden costs of circadian disruption, limited recovery, and cumulative mileage. Analysts who maintain updated databases of flight logs, time-zone differentials, and historical results locate value in lines that lag behind these measurable factors, particularly during periods of dense scheduling such as the 2026 summer slate. The patterns hold across multiple leagues because the underlying physiology of adaptation remains constant regardless of sport.