Divergence Mapping in Soccer: Team Performance Metrics Versus Live Betting Line Shifts
Morgan Keller · Aug 24, 2026
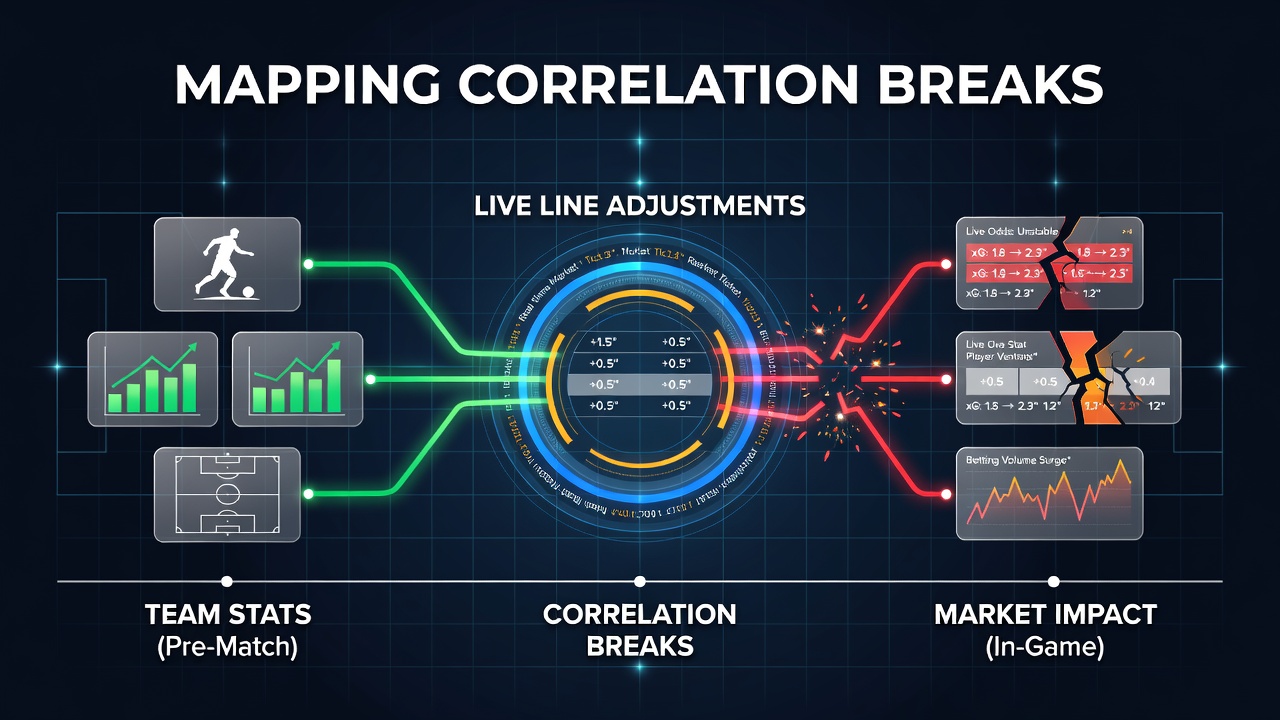
Divergence Mapping in Soccer: Team Performance Metrics Versus Live Betting Line Shifts
Analysts track how team statistics such as expected goals, possession percentages, and shot creation metrics align or diverge from live line adjustments in soccer markets, and researchers map these correlation breaks to identify patterns across major leagues. Data from multiple seasons shows that initial pre-match lines often reflect aggregate historical performance while in-game adjustments respond to real-time events that may not match those same metrics in predictable ways. Observers note that breaks occur when factors like sudden substitutions, weather shifts, or referee decisions override statistical trends that would otherwise influence line movement.
Core Components of Correlation Analysis
Team performance data comes from sources including optical tracking systems and event logs that record passes, tackles, and progressive carries, yet live odds adjust based on market liquidity and bettor activity rather than raw numbers alone. Studies reveal that correlations strengthen during periods of consistent play but weaken when matches feature high variance in scoring opportunities. Those who examine thousands of games find that lines move more aggressively on underdog momentum than the underlying statistics might justify, creating measurable divergence points that repeat across competitions.
Methods for Identifying Breaks
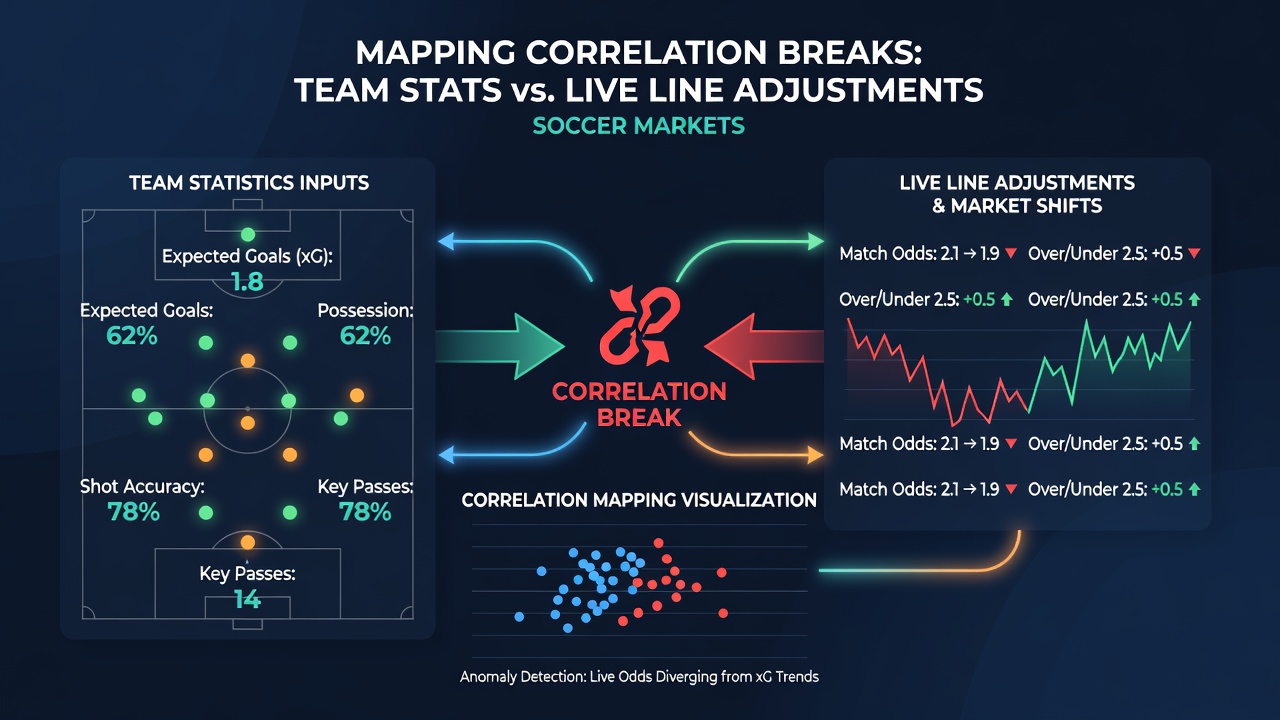
Mapping begins with aligning timestamped statistical events to corresponding line changes from multiple bookmakers, then applying regression models to flag instances where expected movement fails to materialize. Analysts segment data by match phase, home versus away status, and scoreline state because these variables alter both statistical output and market response. When possession climbs above 65 percent without corresponding line tightening, the disconnect signals a potential break that appears more frequently in matches involving teams with variable finishing rates. Software tools process these alignments at scale, highlighting clusters around the 30- and 60-minute marks where adjustments often decouple from cumulative metrics.
Observed Patterns Across Competitions
European domestic leagues adn international tournaments display distinct break frequencies, with faster line reactions in high-stakes knockout fixtures compared to league games. Figures from August 2026 show increased divergence during early-season matches as squads integrate new signings whose contributions do not immediately register in aggregate models. Researchers compare these patterns against historical baselines and find that breaks cluster around set-piece sequences and counter-attacks that generate disproportionate line movement relative to total shot volume. One study tracked 1,200 matches and reported that 22 percent exhibited statistically significant correlation breaks lasting longer than five minutes of game time.
External Factors Influencing Divergence
Live line adjustments incorporate information unavailable in standard team statistics, such as pitch conditions reported by on-site observers or injury updates issued mid-match. These inputs create breaks because models built on pre-game data cannot fully account for sudden environmental changes that alter player output without immediate statistical reflection. Market depth also plays a role, since thinner liquidity in lower-profile leagues allows smaller bet volumes to shift lines away from statistical expectations. Analysts cross-reference weather feeds and official team sheets against line timestamps to isolate these external drivers and quantify their impact on correlation strength.
Applications in Market Monitoring
Operators and data providers use mapped breaks to calibrate automated pricing engines that respond to both statistical feeds and observed market behavior. When correlations hold steady, lines adjust proportionally to metric changes, yet detected breaks prompt manual review or temporary suspension of certain markets. Academic work presented at sports analytics gatherings demonstrates that incorporating break detection improves forecast accuracy for in-play probabilities by reducing reliance on linear assumptions. Those monitoring multiple bookmakers simultaneously track how quickly each platform corrects after a break, revealing variations in data integration speed across regions.
Conclusion
Mapping correlation breaks between team statistics and live line adjustments provides a structured approach to understanding how soccer markets process information differently from pure performance data. Continued collection of aligned datasets across leagues supports refinement of detection methods, and ongoing analysis of August 2026 fixtures continues to add granularity to existing models. The resulting insights assist stakeholders who require precise alignment between statistical reality and market dynamics without assuming perfect correspondence.