Divergence Maps Reveal Fleeting Edges Born From Bookmaker Sync Delays
Viktor Zimmermann · Jun 29, 2026
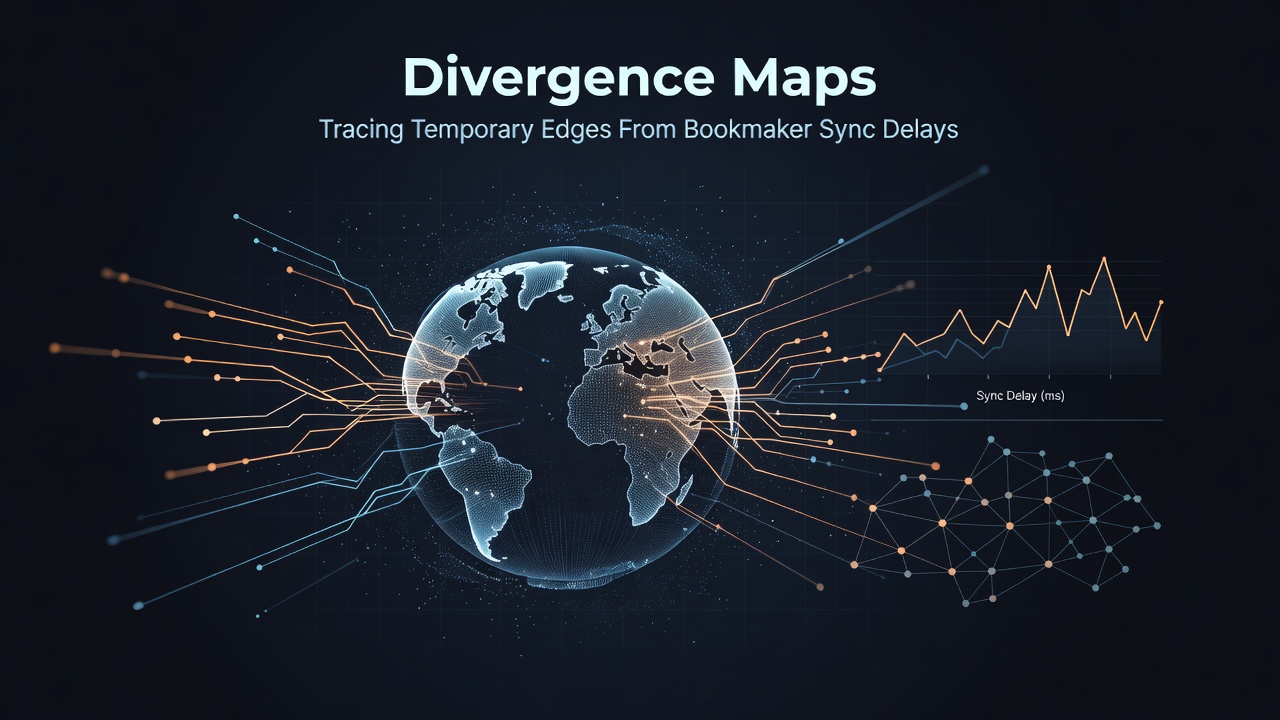
Divergence Maps Reveal Fleeting Edges Born From Bookmaker Sync Delays
Bookmaker platforms update their odds at staggered intervals because of technical infrastructure differences, data feed variations, and regional regulatory requirements, which creates brief windows where lines diverge noticeably from one operator to another. Observers note that these mismatches stem from the time it takes for centralized data providers to push updates through multiple layers of servers and compliance checks, whereas individual books process changes at their own pace. Data from industry monitoring services indicate that such delays typically last between 30 seconds and several minutes during high-volume periods, allowing attentive bettors to identify temporary pricing inconsistencies before the market realigns.
Understanding the Mechanics Behind Divergence Maps
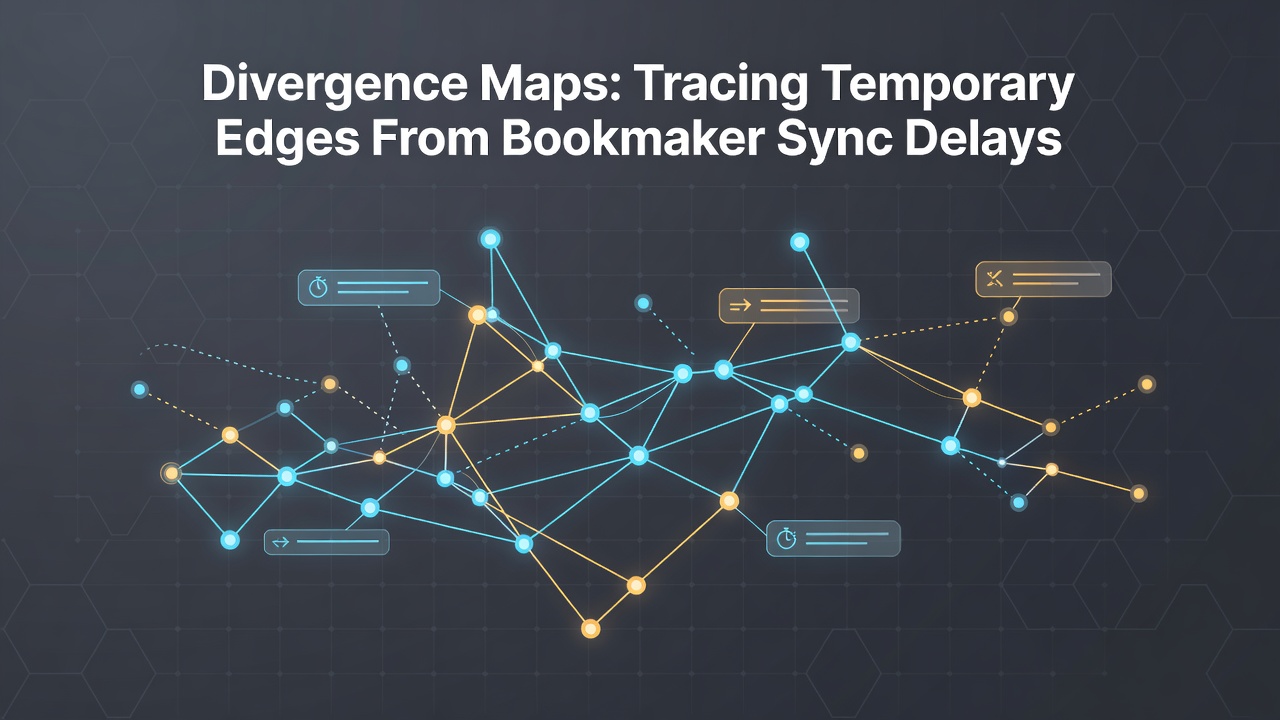
Divergence maps function as visual overlays that plot real-time odds discrepancies across multiple bookmakers on a single interface, highlighting spikes where one platform lags behind others in reflecting new information such as injury reports or weather changes. Researchers at various analytics firms have developed these tools by aggregating API feeds from dozens of operators, then applying algorithms that flag deviations exceeding predefined thresholds like 2% or more in implied probability. According to reports compiled by the Alcohol and Gaming Commission of Ontario, synchronization gaps widen during live events when rapid score updates strain legacy systems at smaller operators, while larger platforms with dedicated data pipelines adjust almost instantly.
People who monitor these maps often focus on sports with frequent in-play adjustments, including soccer, basketball, and tennis, because those markets generate the highest volume of line movements. Studies from academic sources such as the University of Nevada's gaming research center have shown that divergence events cluster around major tournaments, where simultaneous global betting activity overwhelms slower feeds and produces measurable edges for those equipped with automated alerts. The maps themselves display color-coded heat zones that shift as discrepancies resolve, giving users a timeline view of how quickly each bookmaker incorporates the same underlying data.
Identifying Temporary Edges in Practice
Traders who employ divergence maps typically set parameters to capture only those opportunities that persist long enough for manual or semi-automated execution, filtering out noise from minor tick variations. Evidence suggests that edges appear most reliably when one bookmaker sources its lines from a secondary provider that updates on a five-minute cycle rather than a live stream, creating predictable lags during breaking news. In June 2026, monitoring services recorded elevated divergence activity across North American sportsbooks during the NBA Finals period, as rapid roster announcements exposed differences in update speeds between state-regulated platforms and offshore books.
Take one case where experts tracked a mid-game total line in professional hockey that moved first on major European exchanges before slower domestic operators caught up, resulting in a brief window for wagers at inflated or deflated totals. Those who study these patterns emphasize that success depends on low-latency connections and pre-funded accounts across multiple platforms, since the window closes once the lagging bookmaker refreshes its feed. Figures from the American Gaming Association reveal that operators have invested heavily in faster data pipelines precisely to reduce exploitable gaps, yet complete elimination remains elusive because of varying international data regulations and legacy software constraints.
Regional Variations and Regulatory Influences
Sync delays manifest differently across jurisdictions because some regulators mandate additional verification steps before lines can update, which stretches the lag interval compared to less restrictive markets. Observers note that European operators often align faster on soccer markets due to unified data standards, whereas fragmented state rules in the United States produce wider spreads during cross-border events. Research indicates that divergence frequency drops when operators adopt unified APIs from providers such as Sportradar or Genius Sports, yet residual gaps persist during peak hours when server loads spike.
Those who've examined historical datasets point out that major calendar events like the Olympics or World Cup qualifiers generate the longest-lasting discrepancies, as global interest overwhelms even advanced synchronization systems. Maps built for these periods incorporate predictive elements that estimate how long a detected edge might remain open based on past refresh rates for each bookmaker involved. Data shows that average edge duration has shortened from 90 seconds in earlier years to around 45 seconds by mid-2026, reflecting incremental improvements in feed technology across the sector.
Tools and Techniques for Tracking Divergences
Software platforms designed for this purpose combine live odds scraping with timestamp analysis to produce the maps, often integrating machine learning models that learn each bookmaker's typical refresh cadence. Experts recommend cross-referencing map signals with primary news sources to confirm whether a detected divergence stems from genuine delay or from differing risk models at play. People who maintain these systems report that combining divergence data with volume indicators helps distinguish fleeting technical lags from deliberate line shading by the books themselves.
Case studies from Canadian provincial gaming reports highlight instances where divergence maps flagged opportunities in horse racing totals that resolved within 60 seconds once the primary track feed updated all downstream operators. Such examples illustrate how the maps serve both as diagnostic tools for market efficiency and as tactical aids for time-sensitive bet placement. Observers continue to refine these approaches as new data standards emerge and operator infrastructure evolves.
Conclusion
Divergence maps provide a structured method for tracing how sync delays translate into short-lived pricing inconsistencies across betting platforms, with the underlying mechanics rooted in technical and regulatory differences between operators. Evidence from multiple monitoring sources demonstrates that these patterns recur predictably around high-activity periods, offering measurable though transient opportunities when combined with appropriate execution speed. As technology advances, the duration and frequency of such edges continue to shift, yet the fundamental role of divergence tracking remains central to understanding real-time market dynamics in regulated and unregulated environments alike.