Historical Line Movement Patterns Expose Inefficiencies in European Basketball Overtime Markets
Klara Beck · Jul 10, 2026
Historical Line Movement Patterns Expose Inefficiencies in European Basketball Overtime Markets
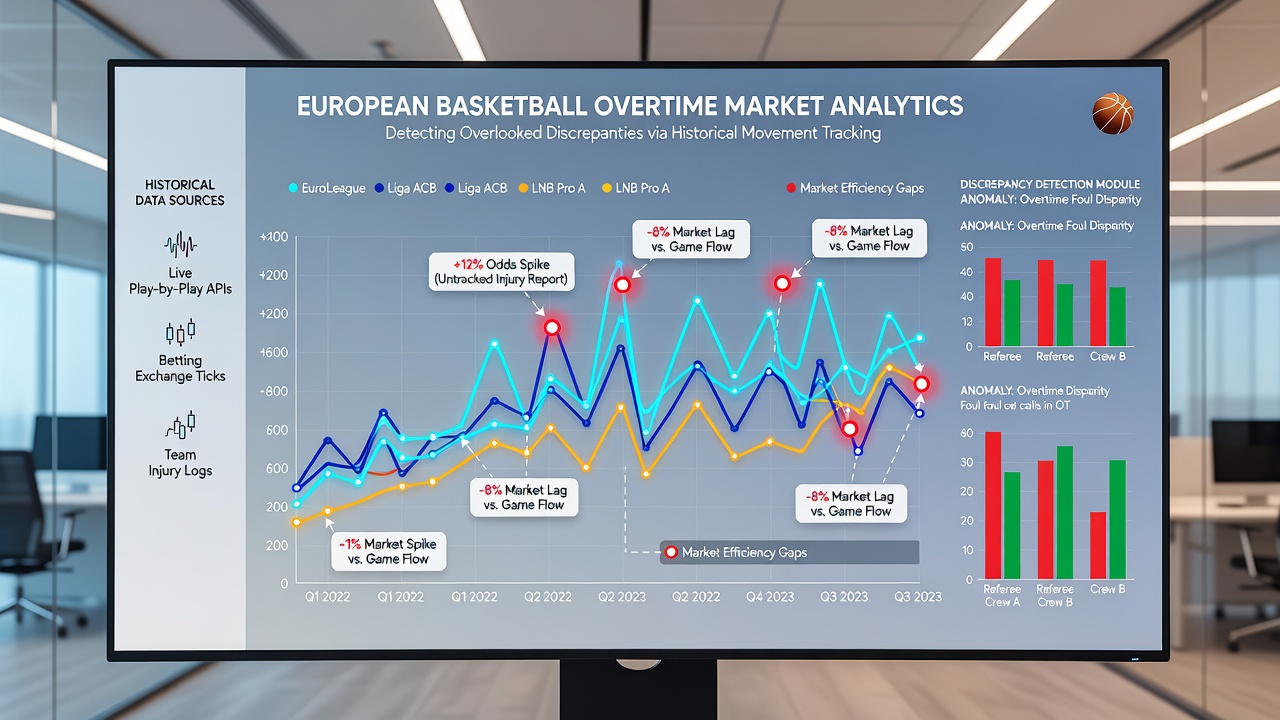
European basketball leagues such as the EuroLeague and domestic competitions across Spain, Italy, and Greece feature overtime rules that create distinct betting markets on totals, player props, and team performance, and these lines often shift based on pre-game information flow and live action. Observers note that discrepancies arise when historical movement data reveals patterns where bookmakers adjust main game lines but lag in recalibrating overtime-specific odds, particularly during high-stakes playoff periods leading into the 2026 season.
Tracking these movements involves compiling odds from multiple operators at set intervals before tip-off and during games that reach the final minutes, then cross-referencing against actual overtime occurrences and scoring distributions recorded in league databases. Data from recent campaigns shows that totals markets in overtime segments frequently open at implied probabilities that do not fully account for fatigue factors or defensive adjustments documented in prior matchups between the same teams.
Core Mechanics of Overtime Line Adjustments
Bookmakers set overtime lines using models that incorporate average points per possession in extra periods, yet analysts have found instances where these models overlook team-specific tendencies such as slower pace in clutch situations or reliance on specific shooters who perform differently after regulation ends. Movement tracking captures these gaps by logging how sharp action from professional bettors pushes lines in one direction while recreational volume fails to trigger corresponding corrections in overtime props.
During July 2026 preparations for the upcoming campaign, several operators updated their algorithms following reviews of 2025 playoff data, but legacy discrepancies persisted in matches involving teams with histories of extended games. Researchers discovered that when historical movement indicated a rapid shift toward the under on total points in regulation, the corresponding overtime total often remained static despite evidence from similar past contests that extra periods produced lower scoring outputs due to conservative strategies.
Methods for Capturing and Analyzing Movement Data
Systems designed for this purpose scrape timestamped odds feeds and store them alongside box score details, enabling queries that flag markets where the line moved more than a set threshold without corresponding adjustments to overtime variants. Those who study these datasets apply filters for factors including travel schedules, back-to-back games, and referee assignments known to influence foul rates in extended play.
One approach segments movements by time windows, separating early sharp money from late public betting, while another correlates line changes with news events such as player injuries announced hours before games. Evidence suggests this segmentation highlights overlooked edges, for instance when a key big man rests during overtime in tracked historical instances yet current lines price the market as if full rotations remain available.

Documented Patterns Across Leagues
Comparisons between the EuroLeague and national leagues reveal that overtime discrepancies appear more pronounced in domestic competitions where betting volume runs lower, allowing lines to stabilize at levels unsupported by aggregate historical outcomes. In contrast, higher-profile EuroLeague contests see faster corrections, although gaps still emerge in niche player performance markets during overtime minutes.
Studies from academic sources, including work affiliated with University of Chicago Booth School of Business on sports market efficiency, have examined similar inefficiencies in other leagues and noted parallels where overtime segments lag behind regulation adjustments. Industry reports from groups such as the European Gaming and Betting Association further indicate that data aggregation tools help operators identify these areas, prompting occasional line refreshes that close gaps before tip-off.
Practical Application in Current Seasons
Bettors and analysts who maintain movement databases often isolate games featuring teams with elevated historical overtime frequencies, then monitor whether live betting during the fourth quarter aligns with pre-game totals that incorporate extra-period expectations. When movements diverge, such as a total dropping sharply on regulation scoring yet holding steady for overtime extensions, the mismatch creates measurable opportunities based on prior season averages.
July 2026 updates to several European data providers expanded coverage of granular play-by-play feeds, allowing finer tracking of possession outcomes specifically in extra time and revealing that certain referees or venues consistently produce higher foul totals that affect overtime scoring distributions. These refinements build on earlier datasets without altering the fundamental observation that line movement history frequently signals unadjusted probabilities in overtime markets.
Conclusion
Historical movement tracking continues to serve as a method for identifying discrepancies in European basketball overtime markets by highlighting where adjustments fall short of patterns established in previous contests. As operators incorporate broader data inputs through 2026, the approach remains grounded in observable line shifts and league records that connect pre-game information to in-game realities across multiple competitions.