How Home Plate Umpire Patterns Influence Run Line Outcomes in Major League Baseball Games
Viktor Zimmermann · Aug 17, 2026
How Home Plate Umpire Patterns Influence Run Line Outcomes in Major League Baseball Games
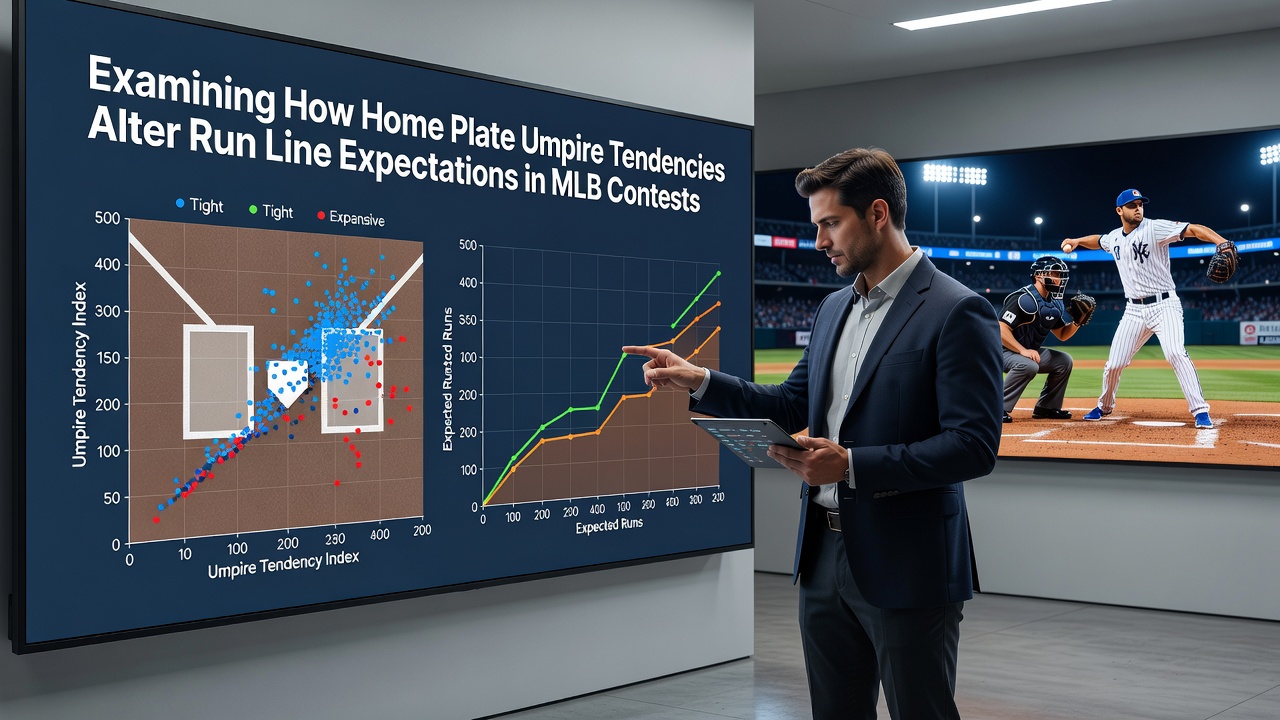
Data compiled across recent MLB seasons shows that home plate umpires exhibit measurable differences in strike zone dimensions, and these variations correlate with shifts in run totals that directly affect run line betting markets. Researchers tracking pitch-by-pitch data have documented that certain umpires expand the zone vertically while others tighten it horizontally, producing distinct effects on walk rates, strikeout totals, and overall scoring environments.
Teams playing under umpires who call a larger strike zone experience fewer walks on average, which reduces baserunner opportunities and compresses run production in many contests. Conversely, smaller strike zones lead to higher walk rates and extended at-bats, creating conditions where total runs exceed the posted run line more frequently. Statistical models built from 2024 through early 2026 demonstrate these patterns hold across both American and National League parks, though the magnitude varies by ballpark dimensions and pitching staffs.
Strike Zone Measurements and Scoring Correlations
Analyses from the Elias Sports Bureau and independent tracking systems reveal that the top 10 percent of umpires by vertical zone size allow approximately 0.4 fewer runs per game than the bottom 10 percent. This gap translates into measurable movement on the run line, since MLB run lines typically center around a total of 8.5 to 9.5 runs depending on the matchup. Observers note that games handled by high-zone umpires trend toward the under side of the run line more often than league averages would predict, while low-zone umpires push totals upward.
These tendencies remain stable within individual umpires across multiple seasons, yet they shift when an umpire works different stadiums or crews. August 2026 data from the first three weeks of that month indicates the same umpire-specific patterns continued without significant deviation, even as leaguewide scoring dipped slightly due to weather and scheduling factors.
Impact on Run Line Markets and Betting Lines
Betting markets adjust totals and run lines based on starting pitchers and weather forecasts, but umpire assignments often receive less public attention despite their documented influence. When sharp bettors incorporate umpire strike zone history into models, they identify edges where the posted run line sits above or below the expected total given the assigned umpire. One study released by researchers at the University of Illinois examined over 12,000 games and found that incorporating umpire metrics improved run total prediction accuracy by roughly 4 percent compared with pitcher-and-park models alone.
Run line expectations therefore change once the home plate umpire is confirmed, typically 60 to 90 minutes before first pitch. Sportsbooks that update lines quickly in response to late information can limit exposure, while slower adjustments create windows for bettors who monitor umpire data feeds.
League Data and Umpire Crew Effects
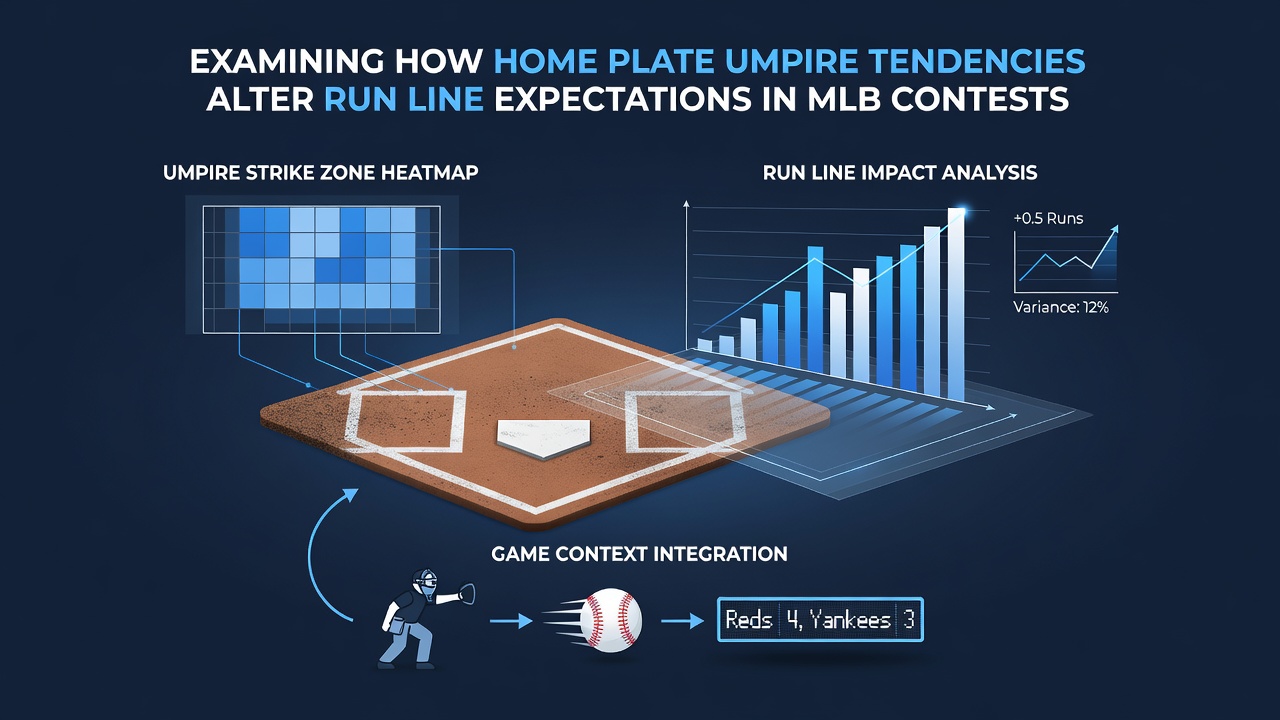
League-wide figures released by Major League Baseball show consistent year-to-year variation among the 80-plus umpires who work home plate. Crew chiefs tend to influence the group, and data indicates that certain crews maintain tighter zones throughout a series. Those who have examined crew-level statistics note that run totals drop by an average of 0.3 runs when a high-zone crew works consecutive games at the same park.
Pitchers who rely on command rather than velocity benefit most from expanded zones, while power arms who miss bats suffer when the zone shrinks. This interaction between pitcher type and umpire tendency further refines run line forecasts beyond simple park factors.
Tracking Tools and Public Availability
Publicly accessible databases now compile umpire-specific metrics including called strike percentage above and below the zone, horizontal and vertical expansion rates, and historical run environments. These resources allow bettors and analysts to cross-reference upcoming assignments with past performance at the same venue. Several industry reports from the Society for American Baseball Research have validated the predictive value of these metrics when layered onto standard sabermetric models.
August 2026 assignments published by MLB show no major changes in the umpire rotation schedule compared with prior years, which keeps historical data relevant for current projections. Observers tracking these releases emphasize that the continuity helps models maintain accuracy across the season.
Conclusion
Strike zone tendencies among home plate umpires create measurable and repeatable effects on run totals that alter run line expectations in MLB contests. Data from multiple seasons, including patterns observed through August 2026, confirms that zone size differences correlate with shifts in walks, strikeouts, and scoring. Markets that incorporate these factors alongside traditional inputs gain precision, while those that overlook umpire history leave room for adjustment once assignments become known. Continued collection of pitch-level data ensures these relationships remain quantifiable for future seasons.