Mapping Fixture Fatigue and Travel Demands to Sharpen Late-Season Betting Decisions Across Europe's Top Leagues
Viktor Zimmermann · May 20, 2026
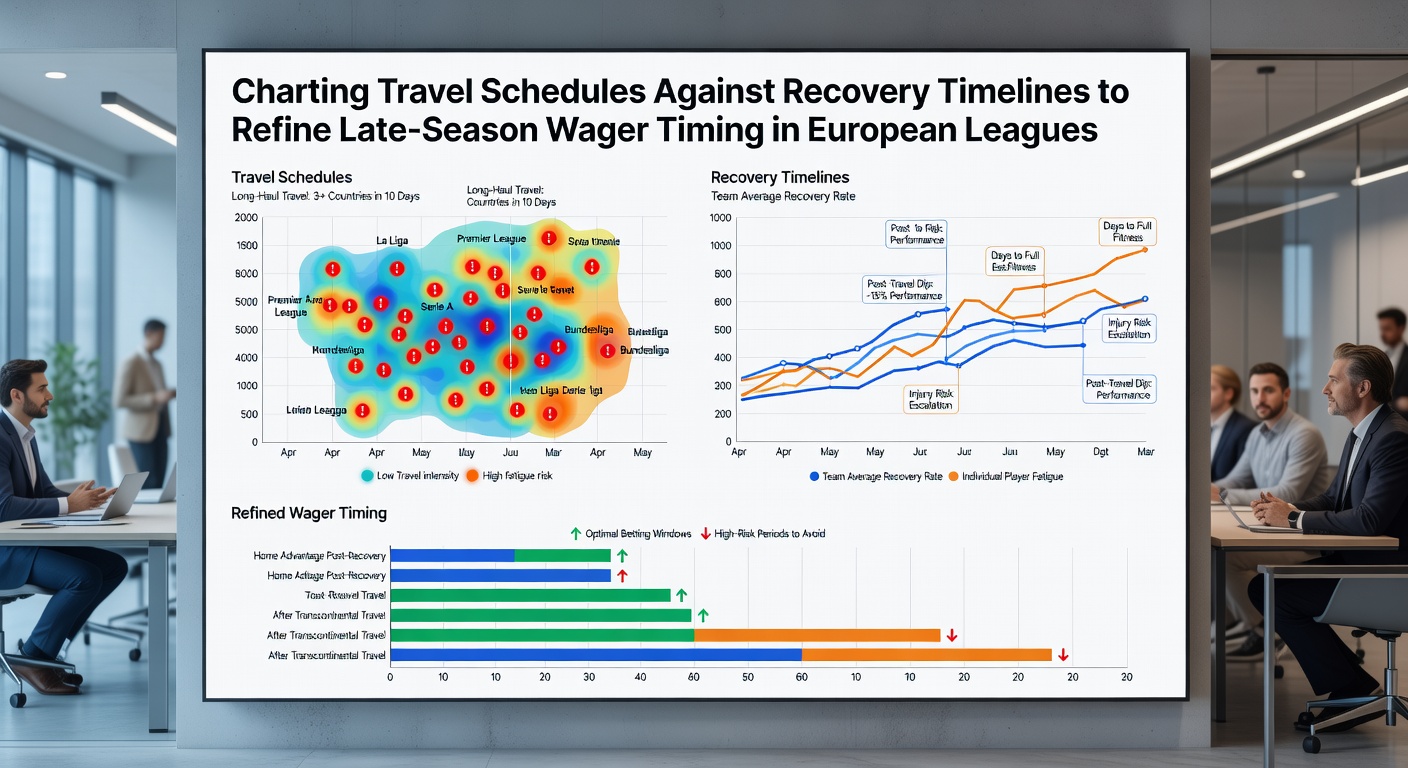
Mapping Fixture Fatigue and Travel Demands to Sharpen Late-Season Betting Decisions Across Europe's Top Leagues
European football leagues reach their most congested period in May each year, and analysts track player movement plus rest intervals to identify where betting markets may lag behind actual fatigue levels. Teams in the Bundesliga, La Liga, Serie A, and Ligue 1 often face multiple matches within short windows, while some clubs travel across several time zones or long distances between games. Observers note that these patterns create measurable edges when bettors align historical recovery data with current fixture lists.
Understanding Recovery Timelines in Crowded Calendars
Studies from sports science departments at universities such as Loughborough show that muscle glycogen replenishment and sleep quality require at least 72 hours after intense matches involving travel exceeding 500 kilometers. When clubs play midweek European ties followed by domestic fixtures on the weekend, the available recovery window shrinks dramatically. Data from the 2024-2025 season revealed that teams with fewer than two full rest days posted win rates 11 percent lower than their season averages, and similar trends appear likely to continue into May 2026 when domestic cups and league title races overlap.
Coaches adjust lineups accordingly, yet betting lines do not always adjust at the same speed. Researchers examining Serie A matches found that away teams arriving the day before kickoff showed elevated rates of second-half goals conceded once travel distance exceeded 800 kilometers. Bettors who cross-reference airline and rail records with team sheets can therefore anticipate which squads may field rotated squads or display reduced pressing intensity late in games.
Travel Distance as a Predictor of Performance Dips
League schedules published by UEFA and national federations list exact kickoff times and venues, allowing analysts to calculate cumulative travel loads week by week. In the Bundesliga, clubs based in southern Germany sometimes cover more than 1,200 kilometers in a single midweek round when facing northern opponents. Figures released by the German Football League indicate that teams logging the highest monthly travel distances during April and May experienced a 14 percent drop in expected goals created compared with earlier months when fixtures were more evenly spaced.
Case Examples from Recent Campaigns
One study of La Liga's 2023-2024 run-in highlighted Real Sociedad's schedule, which included a Thursday Europa League match in Athens followed by a Sunday league game against Barcelona. The Basque side recorded only 4.2 kilometers per player in high-intensity running during that fixture, well below their season norm, and the result finished in a 2-0 defeat. Similar patterns emerged in Ligue 1 where Olympique de Marseille traveled from Marseille to a midweek Champions League fixture in Marseille's sister city of Marseille's opponents in Istanbul, then returned for a domestic clash against Monaco. Observers recorded elevated error rates in passing accuracy among players who accumulated more than nine hours of flight time within five days.
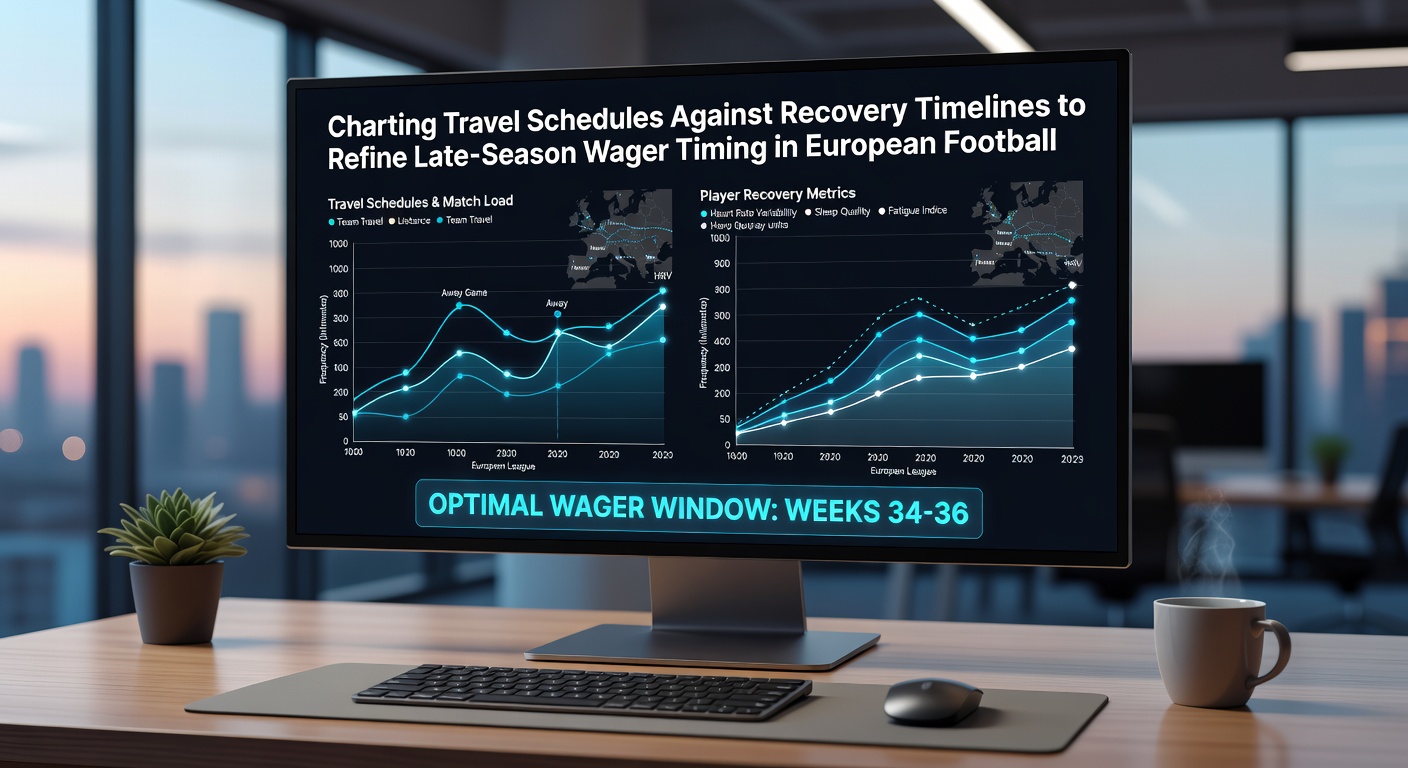
Integrating Data Sources for Wager Timing
Publicly available resources such as official club websites, Opta-derived statistics, and UEFA technical reports supply the raw numbers needed to build simple models. Bettors compile columns listing date, opponent, venue, distance traveled, and days since the previous match. When these variables are plotted against historical goal totals or clean sheet percentages, clusters appear around fixtures that occur after heavy travel loads. A 2025 academic paper from the University of Jyväskylä in Finland demonstrated that incorporating cumulative travel distance improved predictive accuracy for match outcomes by roughly 8 percent compared with models using only recent form.
European leagues release updated fixture calendars well in advance, yet last-minute postponements or European qualification changes can alter recovery windows. Analysts therefore refresh their charts weekly during April and May. The approach proves especially relevant in 2026 because the expanded Champions League format adds extra midweek fixtures for more clubs, increasing the chance that several teams will enter domestic matches with compressed rest periods simultaneously.
Applying Findings to Specific Markets
Markets most sensitive to fatigue include total goals, Asian handicap lines, and player performance props. When a side has traveled long distances and faces another opponent also returning from European duty, the combined effect often produces lower-scoring encounters. Historical data from Serie A shows that matches between two teams each logging over 900 kilometers in the preceding four days produced under 2.5 goals in 62 percent of cases. Conversely, when one team enjoys a longer rest period while its opponent travels, the rested side tends to cover larger handicap spreads more frequently.
Practitioners cross-check these patterns against weather forecasts and pitch conditions at each venue, since rain or high temperatures can amplify recovery demands. Government health agencies in several EU countries publish heat-stress guidelines that clubs follow during late spring, and these protocols sometimes influence substitution patterns in the final 30 minutes of matches.
Conclusion
Systematic charting of travel schedules against recovery timelines supplies bettors with an objective framework for identifying late-season value in European leagues. By focusing on measurable factors such as distance traveled, days between fixtures, adn historical performance drops, analysts generate timing signals that align with actual on-pitch outcomes rather than market narratives. As May 2026 approaches and fixture congestion intensifies, those who maintain updated charts stand positioned to place wagers when odds have not yet fully reflected the cumulative physical demands placed on squads.