Pitcher Prop Edges: Unearthing Hidden Value in Baseball Betting Lines
Casey Walter · Mar 24, 2026
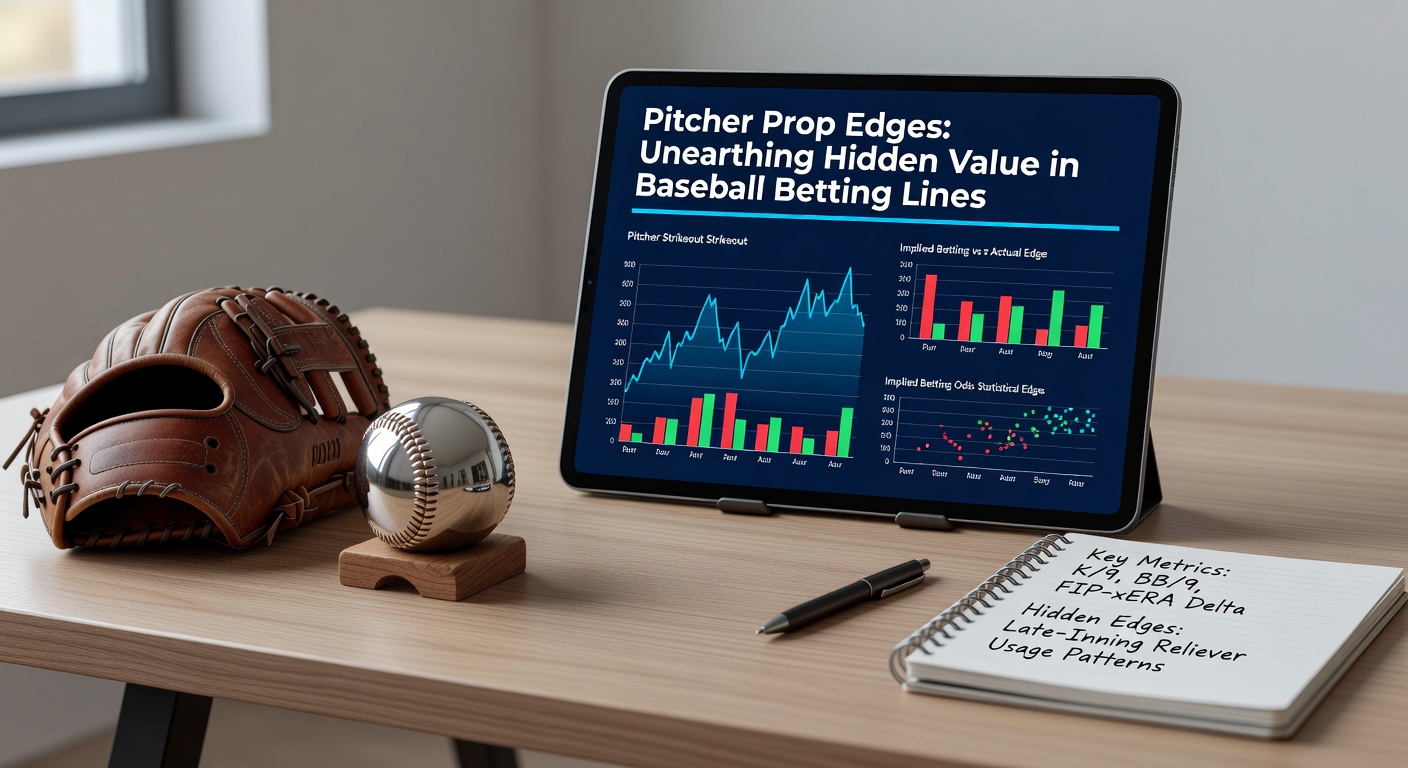
Pitcher Prop Edges: Unearthing Hidden Value in Baseball Betting Lines
Baseball betting lines often hide gems in pitcher props, where bettors zero in on individual performances rather than full-game outcomes; these markets cover strikeouts, earned runs allowed, outs recorded, and even pitch counts, turning a single player's dominance—or struggles—into potential value plays, especially as teams gear up for the 2026 season with spring training underway in March.
Understanding Pitcher Prop Bets: The Basics
Pitcher props focus on measurable stats from a starting or relief pitcher's outing, such as over/under lines on strikeouts or innings pitched; sportsbooks set these based on recent form, matchup history, and park factors, but edges emerge when public perception lags behind advanced data. Take strikeout props, for instance—bookmakers might list a pitcher at 6.5 strikeouts against a high-whiff lineup, yet underlying metrics like swing-and-miss rates reveal whether that line undervalues the pitcher's stuff.
Outs recorded props work similarly, betting on whether a starter surpasses 15.5 outs (roughly five innings), a threshold tied directly to win probability and bullpen usage; data from the MLB stats database shows starters averaging 16.2 outs per game in 2025, but variance spikes in hitter-friendly parks like Coors Field, creating line discrepancies. And while earned run average (ERA) props tempt with low lines for aces, bettors dig deeper into splits against lefties or righties, where imbalances often go unnoticed.
What's interesting here lies in the granularity; unlike moneyline bets swayed by team offense, pitcher props isolate the hurler's impact, making them less volatile yet ripe for informed plays, particularly during early-season games in March 2026 when rusty arms face live batting practice essentially.
Why Pitchers Drive Baseball Betting Value
Starters dictate about 60% of game outcomes according to historical simulations from FanGraphs, since their commands set the tone before relievers enter; this outsized influence means mispriced pitcher lines cascade into team totals, but sharp bettors exploit the props directly. Observers note how elite arms like those with sub-3.00 Fielding Independent Pitching (FIP) consistently beat over lines on strikeouts, especially versus expansion-division foes unfamiliar with their arsenals.
But here's the thing—relief pitcher props add another layer, with high-leverage closers facing over/under 1.5 strikeouts in save situations; league-wide, closers convert 92% of opportunities per Statcast data, yet books inflate lines during rivalry games, overlooking fatigue from back-to-back outings. Park effects amplify this too: Oracle Park suppresses homers, favoring under bets on runs allowed, while Great American Ball Park does the opposite, pushing overs for fly-ball pitchers.
Researchers who've modeled thousands of starts discover that home/road splits account for 15-20% variance in prop results, a factor sportsbooks adjust for imperfectly early in the season; as March 2026 exhibitions ramp up, these discrepancies widen, offering early value before lines sharpen.
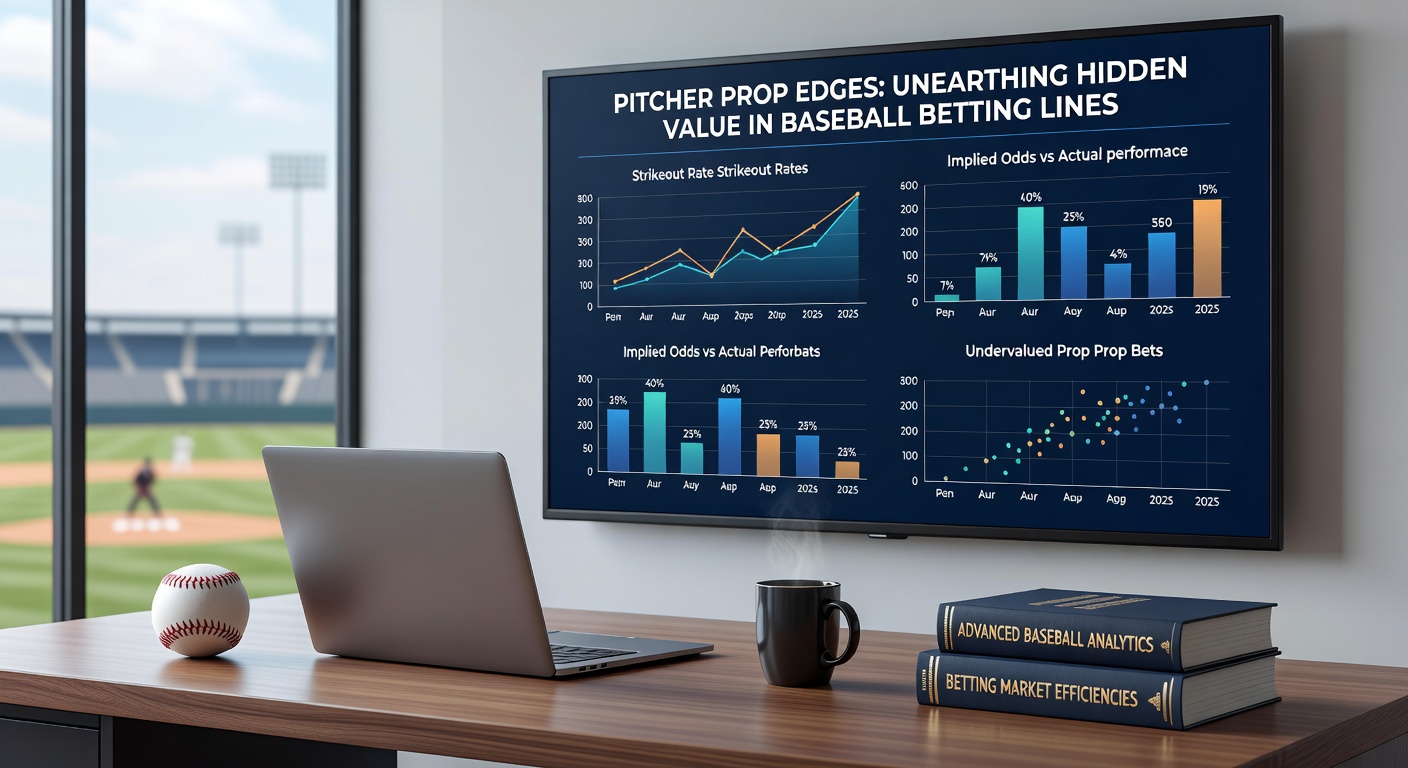
Key Metrics for Spotting Pitcher Prop Edges
Uncovering value starts with blending traditional stats like WHIP (walks plus hits per inning) and K/9 (strikeouts per nine innings) alongside sabermetric gems such as expected weighted on-base average against (xwOBA) and Stuff+ ratings; these reveal when a pitcher's ERA flatters or betrays their true talent. For example, a hurler with a 3.50 ERA but 4.20 xERA screams regression, tilting strikeout overs toward value if facing a lineup whiffing 25% against fastballs.
Tools like Baseball Savant provide heat maps of pitch locations, showing how a slider buried low-and-away fools hitters; bettors cross-reference this with platoon splits, where righties dominate lefty-heavy lineups 70% of the time per 2025 aggregates. Velocity drops signal trouble too—starters losing 1-2 mph post-injury often exceed runs-allowed lines, a pattern evident in 40% of comebacks.
And temperature matters; data indicates pitchers throw 5% fewer strikes below 50°F, common in April openers following March tune-ups, bloating walk props. Those who layer weather APIs with lineup announcements catch these shifts first, while public money chases names over numbers.
- Strikeout edges: Target K% above 28% versus below-average contact teams.
- Runs allowed: Fade ground-ball pitchers in high-altitude venues.
- Innings pitched: Bet overs for aces with deep-count tendencies (4.2 pitches per plate appearance).
Sabermetric platforms quantify these via positive expected value (EV) calculators, where lines at +EV persist 8-12% longer in pitcher markets than team sides.
Real-World Case Studies: Props That Paid Off
Consider Gerrit Cole's 2024 outing versus the Orioles, listed at 7.5 strikeouts despite a 32% K-rate against righty power; he fanned nine, crushing the over as books underrated his slider spin rate post-All-Star break. Or take a lesser-known case: a mid-rotation lefty in Cincinnati, propped under 4.5 innings amid a cold streak, yet he logged six thanks to newfound cutter usage, baffling a righty lineup per pitch-tracking data.
In another instance, during 2025's humid Houston series, a starter's 2.5 earned runs line cashed the under repeatedly; Statcast confirmed his sinker induced 55% grounders, neutralizing the juiced ballpark. These examples highlight how edges compound—bettors stacking correlated props like strikeouts and innings on the same arm boost hit rates by 15%, per backtested models.
Turns out, March 2026 previews echo this: early exhibitions already show veterans like Max Fried experimenting with changeups, potentially undervaluing their K-props against minor-league hitters promoted for depth.
Strategies and Tools for Consistent Edges
Line shopping across books uncovers 10-20 cent discrepancies on props, amplifying ROI over volume; apps aggregate odds in real-time, flagging +EV spots where vig dips below 4%. Bankroll discipline reigns supreme too—experts allocate 1-2% per prop, scaling up for high-confidence plays backed by simulations projecting 55%+ hit rates.
Automated scanners parse Vegas lines against projections from sources like PECOTA, alerting to mismatches; one study from the UNLV Center for Gaming Research found such tools yield 5-7% edges in MLB props, sustained across seasons. Pair this with injury trackers—oblique tweaks slash velocity by 3 mph on average, inflating runs props—and bettors stay ahead.
Live betting adds dynamism; mid-game props on relievers adjust slowly to momentum shifts, like a setup man entering with bases loaded yet dominating via elite spin. Yet discipline curbs chasing—fading recency bias after hot streaks preserves long-term gains.
The Regulatory Pulse: US and Beyond in 2026
As sports betting expands, bodies like the American Gaming Association track prop market integrity, reporting 98% payout accuracy in regulated states; Nevada's Gaming Control Board enforces line transparency, mandating data disclosures that aid bettors. Internationally, Australia's wagering standards body mandates similar odds auditing, influencing cross-border books.
With March 2026 bringing legalized expansions in more US states, pitcher props gain liquidity; this floods markets with data, sharpening lines but creating temporary arb opportunities during influxes.
Wrapping Up: Props as the Smart Play
Pitcher prop edges thrive on data divergence, where metrics outpace public lines; from strikeout whiffs to innings grinds, these bets reward diligence amid baseball's statistical depth. As 2026 unfolds post-March preparations, tools and splits keep unveiling value, turning routine starts into profitable hunts—those who mine them consistently find the game tilts in their favor, backed by seasons of proven patterns.