Referee History Data: Enhancing Soccer Totals Accuracy Through Pattern Analysis
Gisela Lange · Oct 2, 2026
Referee History Data: Enhancing Soccer Totals Accuracy Through Pattern Analysis
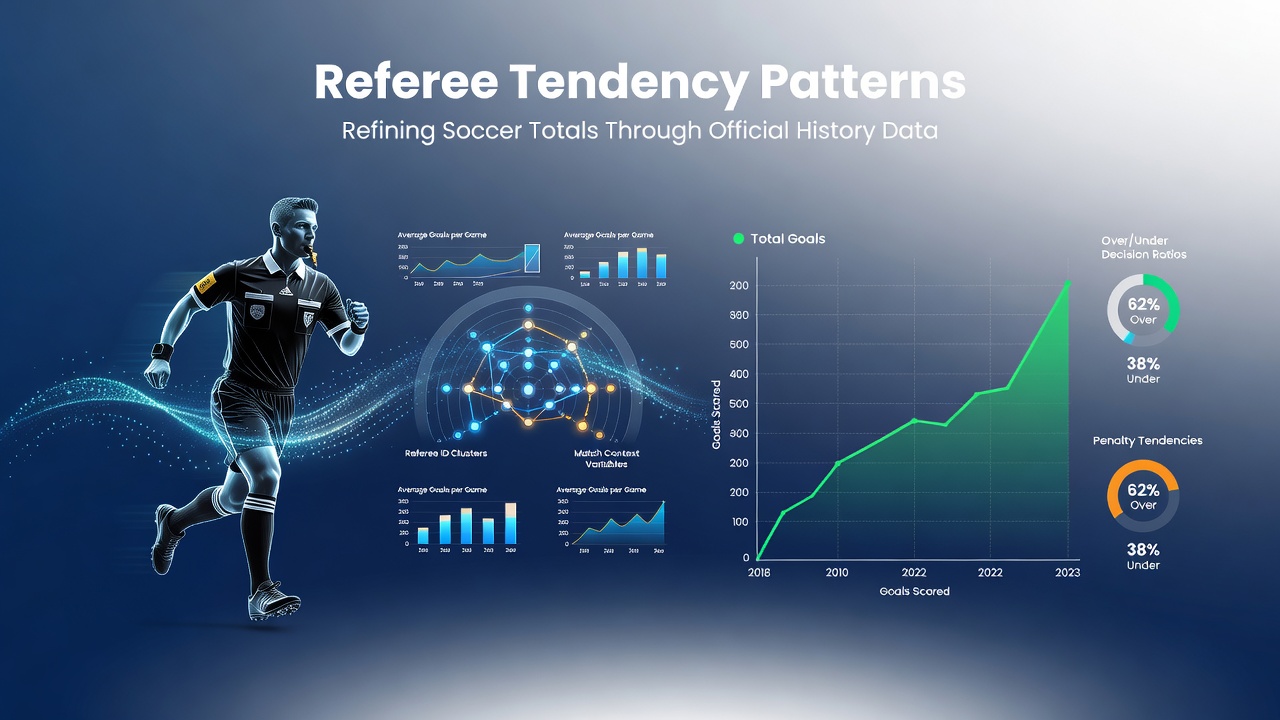
Referee history data offers analysts and bettors a structured way to examine how individual officials influence soccer match totals, particularly in over/under goal markets. Official records from leagues around the world document patterns in fouls, cards, and stoppage time that can shift the expected number of goals in a fixture. Those who study these records find consistent variations across different referees and competitions, allowing for refined projections that go beyond basic team statistics.
Core Components of Referee Tendency Data
Match officials leave measurable traces in game logs, and researchers compile these into usable datasets covering yellow cards per game, red cards issued, average fouls called, and added time at the end of halves. European leagues publish these figures through their statistical arms while North American and Asian federations maintain similar archives. Patterns emerge when the data spans multiple seasons, revealing that some referees maintain higher foul counts while others permit more continuous play.
Studies from the Journal of Sports Sciences have tracked these variables across major competitions and noted that referees with elevated card averages often preside over matches with fewer goals because frequent stoppages disrupt attacking rhythm. Conversely, officials who call fewer fouls correlate with higher goal outputs in certain leagues. The data becomes more precise when filtered by venue, time of season, and competing teams' styles.
Applying Patterns to Totals Markets
Bettors and analysts integrate referee profiles into pre-match models by adjusting baseline goal expectations upward or downward. A referee averaging 5.2 yellow cards per match in the previous campaign might prompt a downward revision of expected goals by 0.3 to 0.5 in a high-tempo fixture. Multiple data providers now release referee-specific metrics that update weekly, giving users access to rolling averages and historical benchmarks.
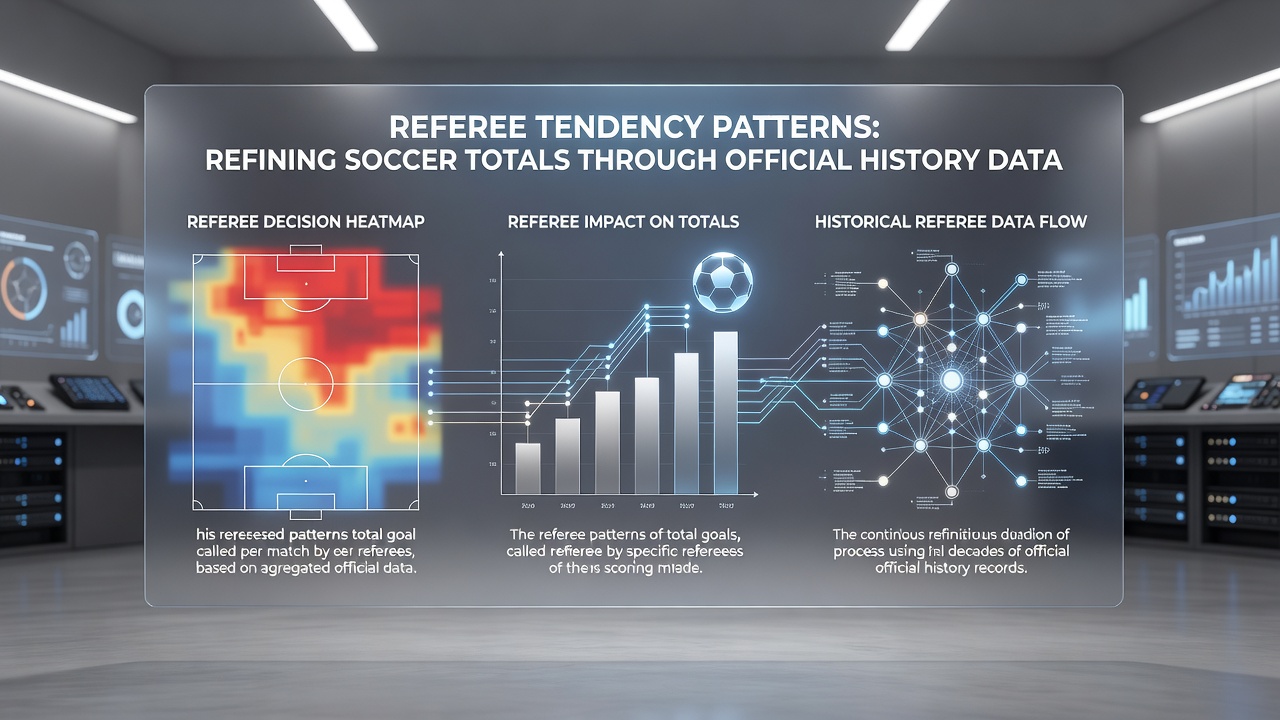
One study conducted by researchers at the University of Groningen examined over 2,000 matches and found that stoppage time added by certain officials correlated with late goals at rates 12 percent above league averages. Those patterns held across both domestic leagues and European competitions, though the effect size varied by region. Analysts now cross-reference these figures with team-specific data on set-piece conversion and injury time performance to refine totals lines.
Regional Variations and Seasonal Shifts
Referee tendencies differ by confederation and even within the same country across divisions. Data from South American leagues shows higher average stoppage times compared with many Asian competitions, while MLS records indicate a gradual increase in added time since 2020. October 2026 brought updated reporting standards in several European federations that now require officials to submit digital logs within 24 hours of each match, improving the speed at which fresh patterns enter public datasets.
Seasonal factors also appear in the records. Referees working midweek fixtures in winter months tend to add slightly more stoppage time than their summer counterparts, according to aggregated figures released by Opta. These small adjustments compound when models process thousands of matches and produce measurable edges in totals betting.
Integration With Broader Analytical Tools
Modern platforms combine referee data with player tracking, weather conditions, and travel schedules. The combined datasets allow for granular simulations that test how a specific official's style interacts with particular teams. Industry reports from the International Betting Integrity Association note that operators increasingly incorporate these multi-variable models when setting totals lines, though the underlying referee component remains one of several inputs.
Those who maintain long-term databases observe that referee patterns remain relatively stable within a single season yet can shift after major rule changes or officiating training cycles. Tracking these shifts requires ongoing access to official match reports rather than reliance on static historical averages.
Conclusion
Official referee history data supplies a verifiable layer of information that refines projections for soccer totals markets. By cataloging fouls, cards, and stoppage trends across thousands of matches, analysts identify consistent influences that team statistics alone do not capture. Updated reporting protocols introduced in October 2026 further support timely integration of these patterns into predictive models. The approach relies on transparent league records and academic studies that document measurable effects rather than anecdotal observation.