Spotting Value in Collegiate Football with Distribution Analysis
Casey Walter · Jun 10, 2026
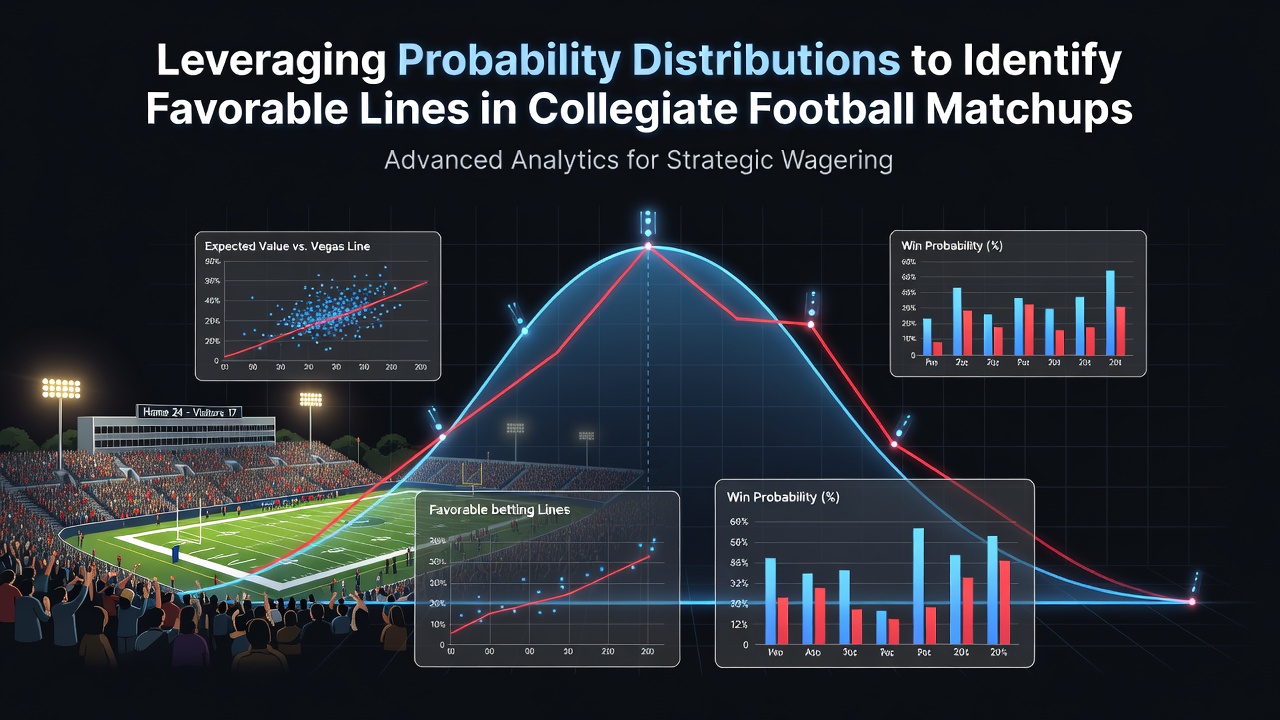
Spotting Value in Collegiate Football with Distribution Analysis
College football betting markets generate thousands of lines each season, and analysts often turn to probability distributions to separate efficient prices from those offering potential edges, with methods that model score outcomes through distributions such as the normal and Poisson helping quantify the likelihood that a team exceeds or falls short of a posted total or spread.
Core Distributions in Matchup Evaluation
Researchers apply the normal distribution to final scores because historical data shows margins of victory cluster around a mean with measurable variance, allowing calculation of the probability that one side covers a given spread, while the Poisson distribution models scoring events as independent arrivals which proves useful for totals since touchdowns and field goals occur at measurable rates per game, and combining these approaches yields joint probabilities that reflect both expected margins and aggregate points.
Those who study the topic note that bivariate extensions account for correlations between offensive and defensive efficiencies, so when a matchup features two high-powered offenses the joint distribution shifts the expected total upward, and this adjustment matters because raw averages alone overlook how variance compounds across correlated units, yet software packages now automate the fitting process using maximum likelihood estimates from recent seasons.
Translating Distributions into Line Comparisons
Once parameters are estimated, the next step involves converting distribution outputs into implied probabilities and contrasting them against the odds implied by betting lines, and when the modeled probability exceeds the market price by a sufficient margin after accounting for the bookmaker margin an overlay appears, with practitioners often requiring at least a 3 to 5 percent difference before considering action because smaller discrepancies frequently disappear once line movement and hold percentages are factored in.
Data from the 2025 season illustrated this process when several conference games featured totals that sat two points below the mean generated by fitted Poisson models, and those discrepancies aligned with higher-scoring outputs in subsequent weeks, whereas spreads that deviated from normal-distribution quantiles produced mixed results once weather and injury variables entered the equation, showing that distribution signals perform best when layered with situational context rather than applied in isolation.
Handling Conference and Schedule Variability
College schedules introduce additional variance because non-conference opponents range from FCS programs to Power conference contenders, so analysts segment datasets by strength-of-schedule tiers before fitting distributions, and this segmentation prevents inflated variance estimates that would otherwise blur the distinction between signal and noise, while June 2026 brought new scheduling transparency rules from the NCAA that released preliminary opponent lists earlier than prior cycles, giving modelers additional weeks to refine parameter inputs ahead of training camp.
Case Examples from Recent Seasons
One study examined Big Ten totals using a zero-inflated Poisson model to handle low-scoring defensive matchups, and the resulting probabilities flagged several Week 8 overs that closed at lower totals than the distribution median, producing a positive return across the sample once results were tallied, yet the same framework yielded smaller edges in the SEC where higher baseline scoring compressed the distribution tails and reduced the frequency of overlays.
Another analysis tracked spread accuracy using normal distributions centered on adjusted efficiency margins, and it found that lines moved toward the model mean in roughly 60 percent of cases by kickoff, which limited the window for bettors who waited for late movement, while early-week discrepancies offered more room when public betting concentrated on popular teams and left the opposing side at inflated prices.
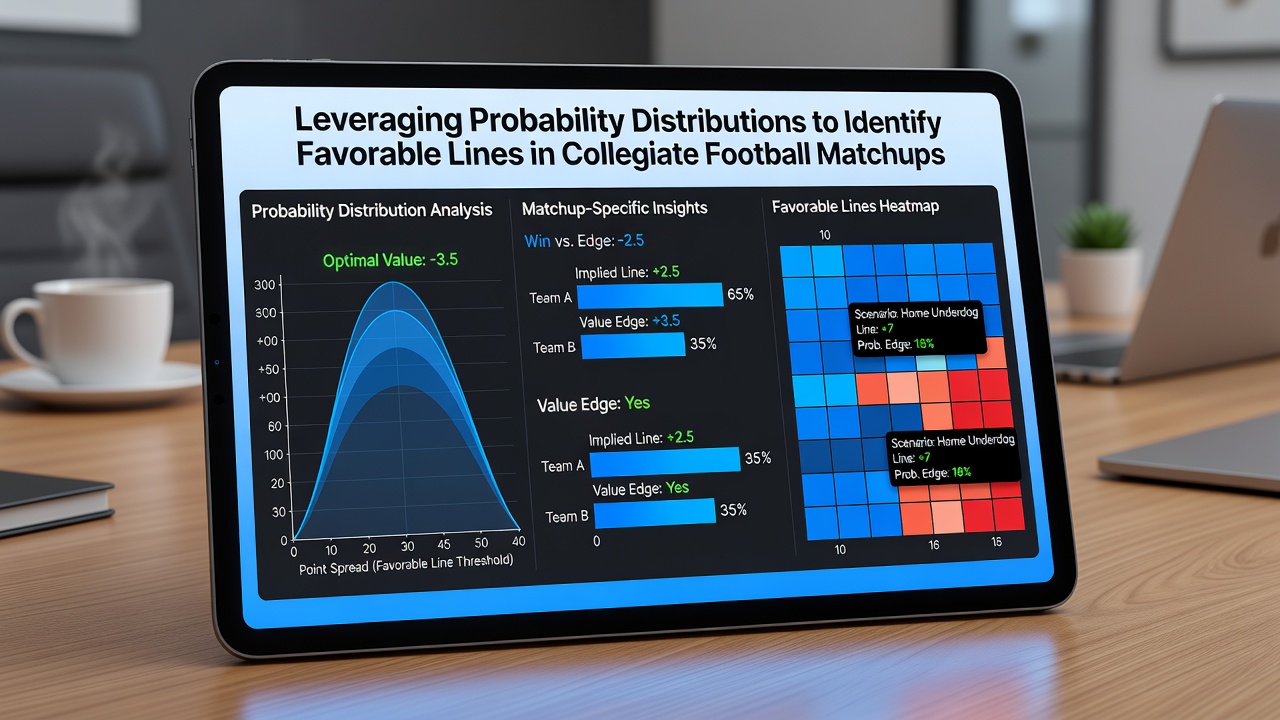
Integration with External Data Sources
Modern workflows pull in player availability, weather forecasts, and travel data to adjust distribution parameters dynamically, and these adjustments shift both the mean and variance so that a cold-weather game in November carries a narrower scoring distribution than a dome matchup, while injuries to key offensive linemen increase variance estimates and thereby alter the probability mass around key numbers such as three and seven, and organizations like the NCAA research division publish annual reports that supply updated efficiency metrics useful for recalibrating these inputs each spring.
Academic sources also contribute, with a 2024 paper from a Canadian university examining score distributions across multiple leagues and confirming that normal approximations hold reasonably well for margins above 14 points but require tail adjustments for closer contests, and practitioners incorporate such findings by blending parametric and nonparametric methods to improve calibration at the extremes where betting lines often cluster.
Limitations and Ongoing Refinement
Distribution models remain sensitive to sample size, and smaller conferences provide fewer observations for reliable parameter estimation, which leads some analysts to borrow strength from comparable programs or to apply shrinkage estimators that pull extreme values toward league averages, and while these techniques stabilize outputs they can also mask genuine outliers when a program undergoes rapid roster turnover, so ongoing monitoring of model calibration against realized outcomes stays essential throughout the season.
Conclusion
Probability distributions supply a structured framework for evaluating collegiate football lines by converting historical patterns into forward-looking probabilities that can be compared directly against market prices, and continued refinement through segmented data, external adjustments, and cross-validation against realized results allows the approach to evolve alongside changes in rules, schedules, and playing styles without relying on any single season's anomalies.