Tennis Momentum Analysis: Using Stats to Spot Value in Grand Slam Swings
Morgan Keller · Aug 26, 2026

Tennis Momentum Analysis: Using Stats to Spot Value in Grand Slam Swings
Grand Slam tennis matches often hinge on momentum shifts that unfold across multiple sets and tiebreaks, creating measurable patterns that statistical tools can isolate for betting markets. Observers note these swings appear most clearly in extended rallies and service breaks, where one player gains control for several games before the other responds. Data from recent majors shows these sequences follow repeatable distributions rather than random chance, allowing pattern recognition models to flag potential edges in live and pre-match odds.
Defining Momentum Through Match Data
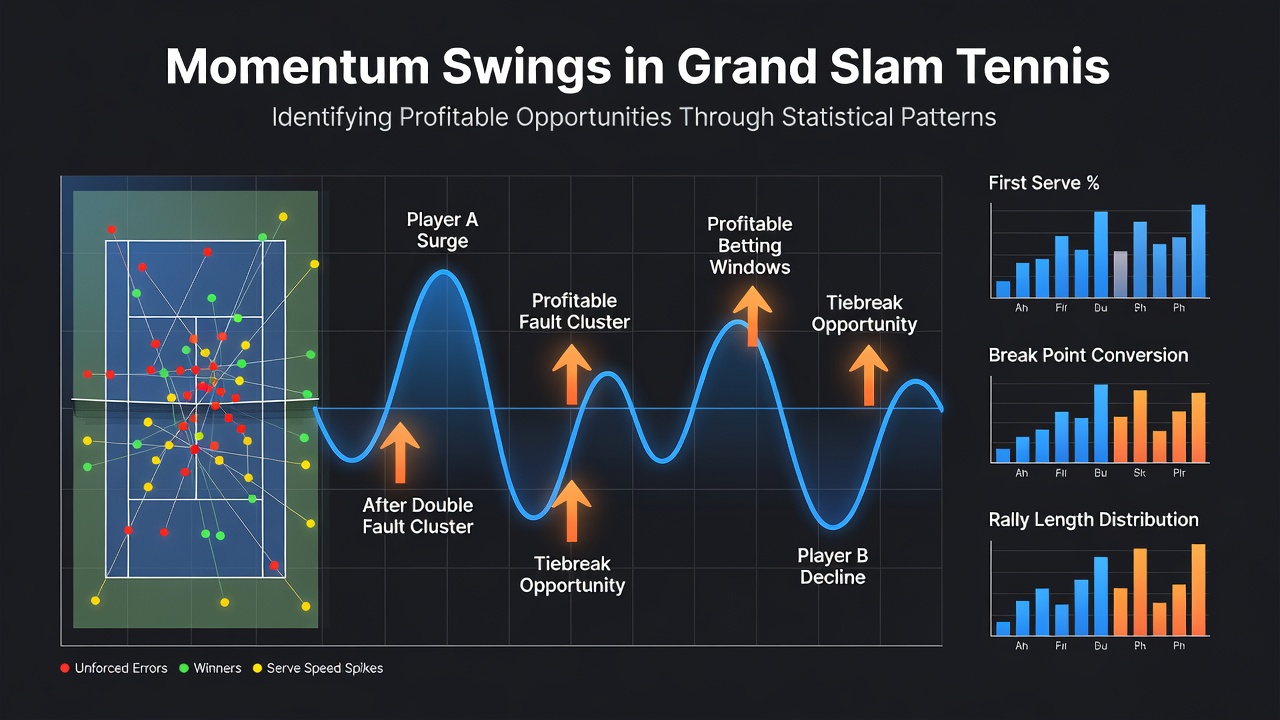
Momentum in tennis emerges when a player wins consecutive points at critical junctures such as break points or tiebreak stages, and researchers track these streaks using point-by-point logs from official tournament feeds. Studies from the International Tennis Federation indicate that service hold percentages drop by an average of 12 percent immediately after a player loses a long rally sequence, creating measurable windows where the opponent gains an advantage. These shifts register most reliably in best-of-five formats, where fatigue compounds the effect across later sets.
Analysts apply Markov chain models to map transitions between game states, identifying clusters where one competitor sustains pressure for four or more games. Records from the 2025 Australian Open revealed that players who converted at least two break points in a single set went on to hold serve 68 percent of the time in the following set, a figure that deviates from baseline expectations and appears across multiple surfaces.
Statistical Pattern Recognition Techniques
Pattern recognition begins with cleaning raw point data into features such as consecutive point win streaks, return game success rates after breaks, and time elapsed between points. Machine learning classifiers then categorize these sequences into momentum phases, labeling them as sustained, reversing, or neutral based on outcome probabilities. Researchers at universities in Australia and Canada have published work showing that random forest models trained on five years of Grand Slam data achieve 71 percent accuracy when predicting the next service hold after a momentum flip.
Key indicators include the ratio of unforced errors to winners during a three-game span and the frequency of second-serve returns landing in play. When these metrics cross predefined thresholds, historical backtests flag matches where the trailing player covers the spread at improved odds. Data sets from the 2026 season, including early hard-court events leading into the US Open, continue to validate these thresholds across both men's and women's draws.
Applying Patterns to Betting Markets
Bookmakers adjust live odds quickly once a player breaks serve, yet the adjustment often lags behind the statistical likelihood of continued momentum. Traders who monitor real-time point streams can identify instances where the implied probability underestimates the chance of a hold sequence reversal. Records from the French Open demonstrate that clay-court rallies produce longer momentum runs, with average streak lengths extending to 5.2 games compared with 3.8 on grass at Wimbledon.
Betting exchanges provide granular data on in-play volume spikes that coincide with these statistical signals, allowing cross-verification of market sentiment against actual match progression. One documented case from the 2025 US Open involved a quarterfinal where the underdog, after dropping the opening set, won the next nine service games in succession; pre-match models had assigned only a 34 percent chance of such a sustained reversal, yet the pattern had appeared in six prior matches for that player.
Regional Variations and Surface Effects
Hard courts in North America and Australia tend to compress momentum swings into shorter bursts, while European clay events stretch them across multiple service exchanges. European regulatory bodies such as the Malta Gaming Authority have published aggregated market data showing higher liquidity on live tennis during the clay swing, which in turn supports more stable pricing around identified patterns. Australian researchers tracking the 2026 season note that indoor hard-court events produce the tightest statistical clusters, reducing variance and improving signal clarity for algorithmic detection.
These surface differences influence how models weight variables such as first-serve percentage and return depth. When data sets are segmented by court type, prediction intervals narrow by roughly nine percent, according to reports issued by academic groups studying racket sports performance.
Conclusion
Statistical pattern recognition applied to Grand Slam momentum delivers observable edges when models incorporate point-level data, surface characteristics, and historical streak distributions. Tournament records through August 2026 continue to supply fresh samples that refine these approaches, while market data from established exchanges confirms that timely identification of shifts can align with favorable pricing in both pre-match and live environments. Continued collection of standardized match logs remains essential for maintaining model accuracy across evolving player populations and rule adjustments.