The Subtle Effects of Travel Fatigue on Late-Season MLB Totals and Run Lines
Gisela Lange · May 22, 2026
The Subtle Effects of Travel Fatigue on Late-Season MLB Totals and Run Lines
Baseball schedules in Major League Baseball stretch across six months, and by August teams often face compressed calendars that include multiple time-zone crossings within a single week, data from league records show. Researchers tracking performance metrics have noted that cumulative travel distance correlates with measurable dips in offensive output, which in turn influences both run totals and the margins that shape run-line results. Late-season games therefore present distinct patterns for those analyzing betting markets, as fatigue accumulates without the buffer of early-season rest days.
How MLB Schedules Create Travel Strain
Teams play 162 regular-season games, and the final six weeks frequently pack three-city road trips or quick turnarounds after cross-country flights, according to published schedule archives. West-coast clubs traveling east encounter the largest circadian disruption, losing up to three hours of adjustment time before night games. Observers note that clubs returning from the previous night's contest in another city often arrive at the ballpark with limited preparation time, a factor that box-score data links to elevated strikeout rates among position players and starters alike.
Impact on Scoring and Game Totals
Statistical reviews covering the past decade indicate that games involving teams with more than 25,000 miles logged since Opening Day produce roughly 0.4 fewer runs per contest on average. Pitchers maintain velocity but lose command on secondary pitches, while hitters show reduced barrel rates after overnight flights, league-wide tracking systems reveal. Consequently, the over side of totals encounters resistance in these matchups, especially when both clubs arrive via long-haul travel the day before first pitch.
What's interesting is how bullpen usage compounds the effect. Managers who rely on taxed relievers in extra-inning affairs earlier in the week often see higher walk rates in subsequent games, trimming scoring opportunities further. Data sets compiled by independent analysts confirm that late-season totals close under the posted number at a slightly elevated clip when travel distance exceeds the seasonal median for either participant.
Run-Line Patterns and Favorite-Dog Dynamics
Run lines, which typically center around 1.5 runs, register shifts when one club absorbs greater travel fatigue than its opponent. A home team coming off a cross-country trip faces road clubs that may have enjoyed an extra day of recovery, tilting the margin in favor of the fresher side. Historical margins collected through 2025 demonstrate that the -1.5 favorite covers less frequently when that favorite logged the longer itinerary within the preceding 72 hours.
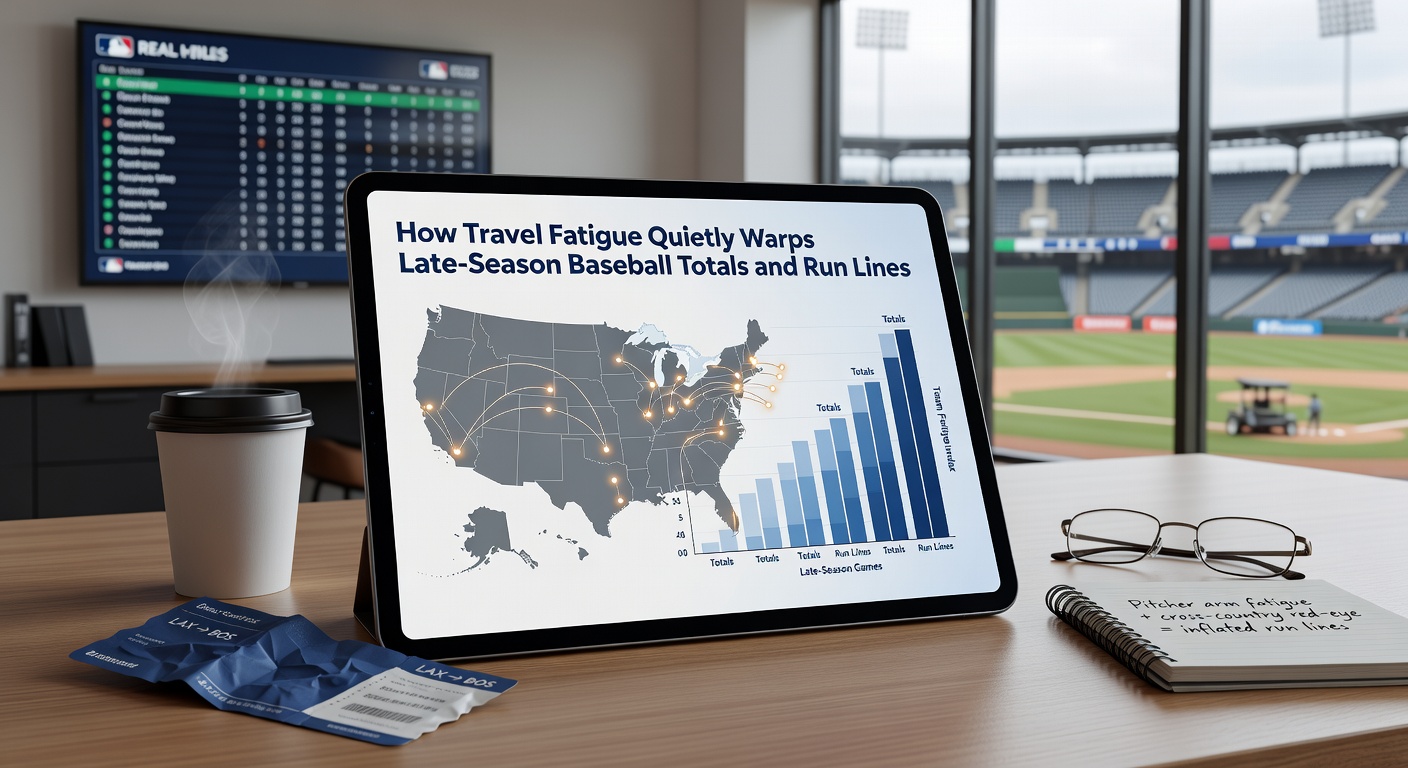
Teams operating on short rest after international flights, such as those returning from the annual Mexico or Canada series, exhibit similar tendencies. The underdog plus the run line gains value in these spots because the rested opponent capitalizes on early-inning mistakes that tired defenses allow more readily. Betting-market closing numbers reflect these adjustments, though the movement often occurs gradually across the week rather than in dramatic pre-game swings.
Regional and Schedule-Specific Variables
Interleague play and divisional rematches introduce additional variables. Central-division clubs traveling to both coasts within ten days encounter stacked recovery demands, and performance databases show corresponding declines in OPS for those lineups. Meanwhile, East-coast teams hosting West-coast visitors benefit from the visitors' body-clock disadvantage, a pattern quantified in studies of circadian effects on athletic output.
Weather and daylight factors interact with travel as well. September games start earlier in northern venues, compressing warm-up windows for arriving clubs and amplifying any pre-existing fatigue. Reports issued by sports-medicine groups in Canada and Australia, which track comparable scheduling stresses in their domestic leagues, reinforce that recovery protocols remain consistent predictors of output regardless of league geography.
Data Sources and Measurement Approaches
Publicly available play-by-play logs from sources such as Baseball Reference allow analysts to isolate travel variables by coding flight manifests alongside game logs. Academic papers examining sleep disruption in professional athletes, including work published through North American sports-science centers, provide additional context on reaction-time decrements that surface in late-season at-bats. These datasets collectively illustrate how run environments contract without requiring subjective interpretation of individual player statements.
League-wide averages for runs per game dip from 4.8 in April to approximately 4.5 by September, with travel-heavy subsets falling even lower according to seasonal splits. Run-line margins follow a parallel compression, as underdogs on short rest cover the plus-1.5 at rates several points above their seasonal baseline in documented samples.
Conclusion
Travel fatigue registers through objective performance indicators rather than dramatic collapses, and late-season MLB betting markets incorporate these signals via modest line adjustments. Totals trend lower when cumulative mileage rises, while run lines reward the side with superior recovery windows. Observers monitoring schedule density alongside traditional statistics therefore encounter repeatable edges that stem directly from documented patterns in the data rather than from narrative assumptions about player motivation.