Timing Multi-Leg Bets with Integrated Historical Data and Live Odds Streams
Viktor Zimmermann · Jul 1, 2026
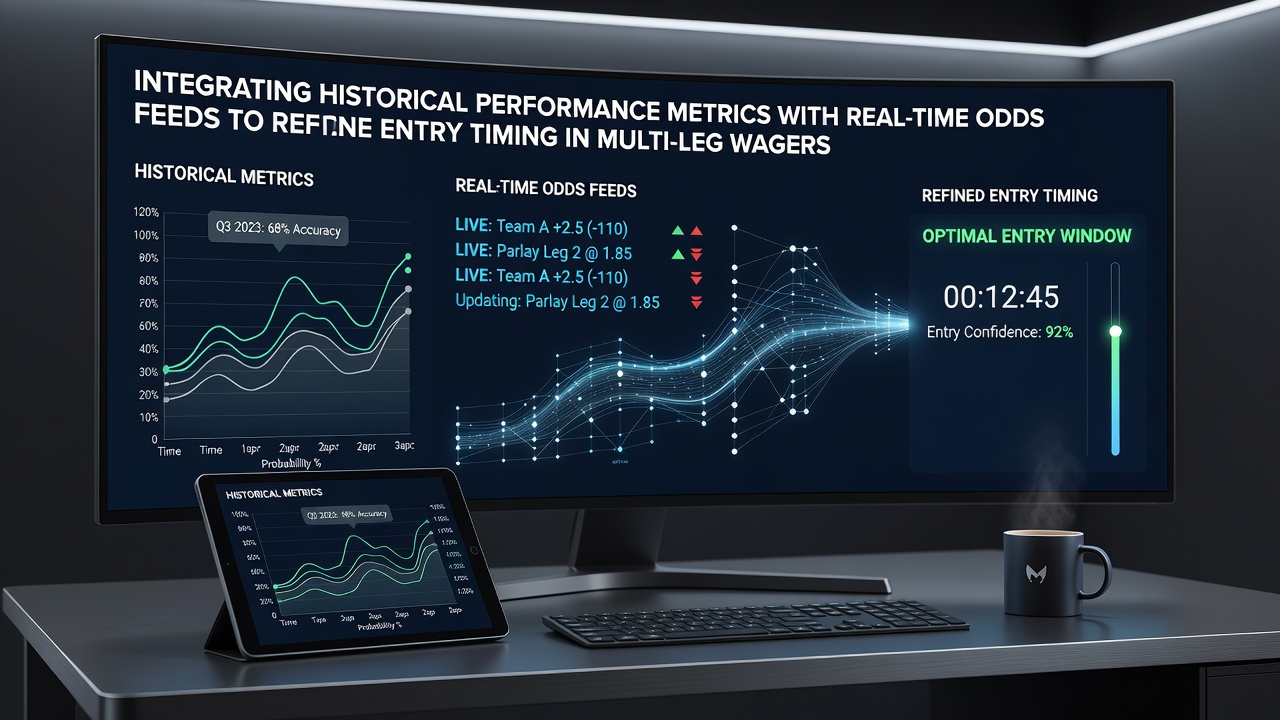
Timing Multi-Leg Bets with Integrated Historical Data and Live Odds Streams
Multi-leg wagers demand precise entry points because each component multiplies both potential returns and exposure to variance, and analysts integrate historical performance metrics with real-time odds feeds to narrow those windows. Historical data sets capture player efficiency ratings, team travel impacts, weather-adjusted outcomes, and head-to-head trends across multiple seasons, while live feeds deliver continuous updates on line movement, liquidity shifts, and implied probabilities. When these two streams merge, timing decisions shift from reactive guesses to structured calculations that account for both proven patterns and current market sentiment.
Building the Historical Layer
Performance databases compile box-score aggregates, advanced metrics such as expected points added, and situational splits that cover home versus away, rest advantages, and opponent strength ratings. Researchers at institutions like the University of Nevada Las Vegas have tracked how these variables influence closing-line value across thousands of events, revealing consistent edges when bettors wait for specific thresholds rather than jumping at opening numbers. One study group examined five years of college football data and found that totals lines moved an average of 1.8 points after the first hour of market activity when historical unders on high-altitude venues aligned with early steam.
Connecting Live Feeds to Entry Signals
Real-time odds APIs push updates every few seconds, allowing algorithms to flag discrepancies between current prices and model-derived fair values. When a historical pattern, such as a starting pitcher’s 0.85 ERA in day games after a night start, coincides with an odds feed showing the total drifting upward, the integrated system can trigger an alert for the correlated leg. Bookmakers in regulated markets including those overseen by the Nevada Gaming Control Board publish aggregated handle data that further refines these signals by indicating where sharp money has already landed.
Refining Entry Windows in Practice
Consider a four-leg NBA parlay constructed around player props. Historical minute-per-game trends and usage-rate splits against specific defenses establish baseline expectations, while the live feed tracks rapid line adjustments once injury reports surface. Observers note that entry often improves when the first two legs reach their modeled price roughly 25–40 minutes before tip-off, allowing the remaining legs to capture any subsequent steam or reverse line movement. This staggered approach reduces the risk of all legs locking at inefficient numbers simultaneously.
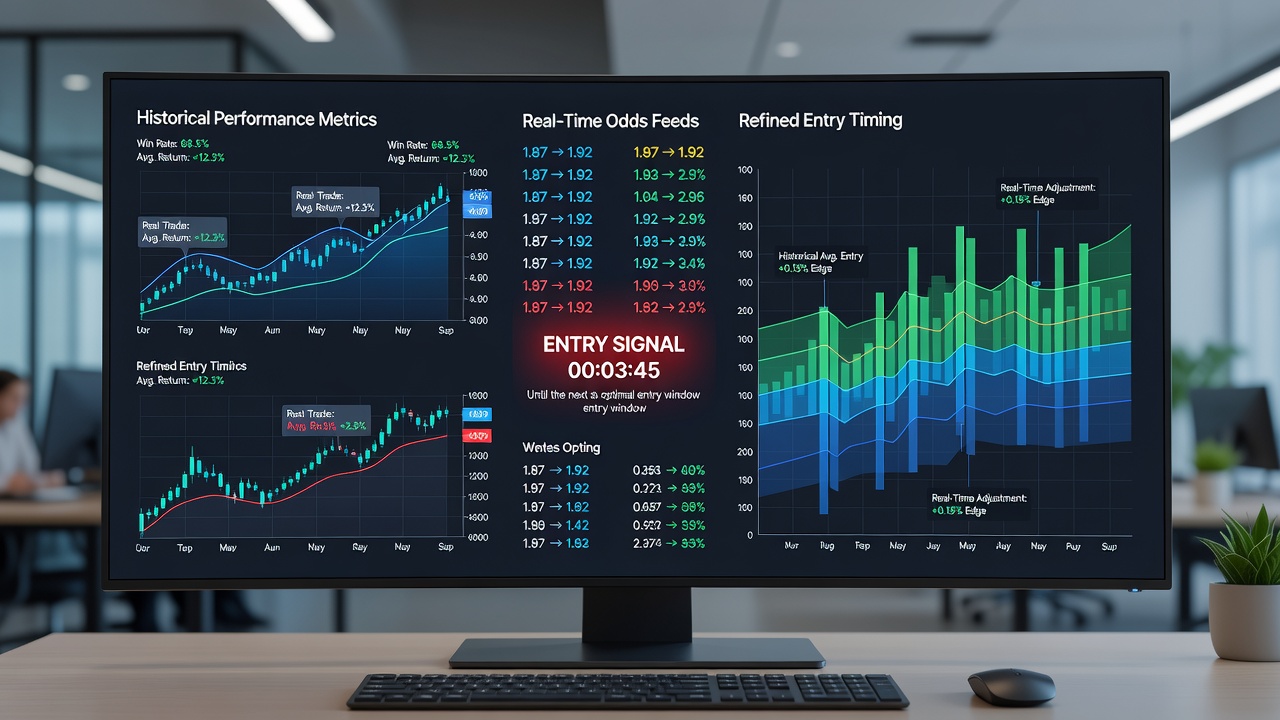
Similar sequencing appears in European soccer accumulators. A research paper from the International Journal of Performance Analysis in Sport examined 12,000 matches and documented how historical set-piece conversion rates combined with live corner-market liquidity produced measurable timing advantages when entries occurred after the 12-minute mark rather than at kickoff. The same framework applies to tennis and baseball where rest, travel, and surface metrics create repeatable correlations that live books reflect gradually.
Data Infrastructure Requirements
Operators and independent bettors maintain synchronized databases that normalize historical statistics into comparable units with live odds formats. This requires mapping player IDs across seasons, adjusting for rule changes, and tagging market-specific variables such as reduced juice periods or correlated prop availability. When the infrastructure functions correctly, alerts surface only when both the historical edge and the current price deviation exceed predefined thresholds, limiting over-betting on marginal situations.
Regulatory Context and Market Evolution
By July 2026 several North American and Australian jurisdictions will have expanded real-time data-sharing mandates between operators and state regulators, increasing the granularity of publicly available liquidity metrics. These changes allow more precise calibration of timing models because feed providers can incorporate official handle and liability figures rather than relying solely on price movement. Industry groups such as the Responsible Gambling Council have published technical briefs outlining how such transparency influences bettor behavior without altering underlying odds integrity.
Conclusion
Integrating historical performance metrics with real-time odds feeds supplies a repeatable framework for determining when multi-leg wagers should be placed. The method relies on documented statistical relationships, continuous market monitoring, and structured alert thresholds rather than intuition. As data standards evolve across regulated markets, the precision of these timing models continues to improve for those who maintain robust synchronization between past records and present pricing.