Venue Microclimates as Indicators for Wagering Line Adjustments in Outdoor Professional Sports
Morgan Keller · Aug 19, 2026

Venue Microclimates as Indicators for Wagering Line Adjustments in Outdoor Professional Sports
Outdoor league contests unfold under conditions that extend far beyond broad regional forecasts, and analysts track these finer details because localized climate pockets often precede movements in betting lines. Data from multiple seasons show that temperature gradients, wind patterns, and humidity pockets at specific venues correlate with shifts in totals and side markets for baseball, soccer, and football events. Observers note that these microclimates arise from stadium architecture, surrounding terrain, and even nearby water bodies, creating environments that differ measurably from city-wide readings.
Understanding Microclimate Formation at Sports Facilities
Stadiums generate their own thermal and airflow signatures through concrete seating bowls, artificial turf surfaces, and partial roofing structures, while researchers at institutions such as the University of Melbourne have documented how afternoon heat retention in open-air venues can elevate playing-surface temperatures by several degrees compared with official airport stations. Wind channeling occurs when grandstands funnel prevailing breezes into consistent cross-field patterns or create sheltered zones near home plate or goal lines, and humidity levels fluctuate when irrigation systems or nearby rivers introduce moisture not captured in standard forecasts. These factors combine to alter ball flight, player endurance, and scoring rates in measurable ways that line makers and bettors monitor through specialized sensors.
Data Collection Methods and Seasonal Patterns
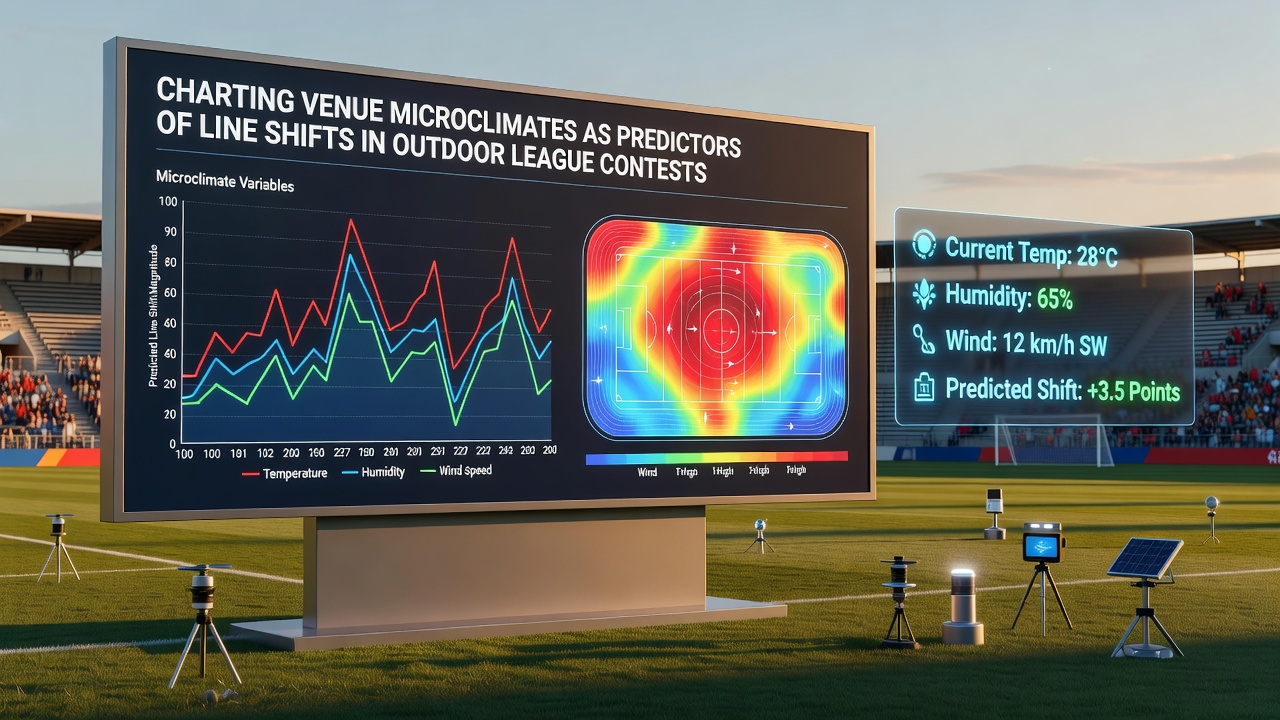
Teams and independent analysts deploy arrays of portable weather stations around playing fields to record conditions at five-minute intervals throughout game days, and August 2026 brought expanded deployment of these networks across North American and European leagues as new partnerships with meteorological agencies supplied higher-resolution feeds. Historical datasets reveal that certain venues exhibit repeatable evening cooling rates that suppress run totals in baseball during late-summer months, while other sites maintain elevated humidity that correlates with increased passing efficiency in football contests. Cross-referencing these readings against final score outcomes allows models to quantify how a two-degree temperature differential or a three-mile-per-hour wind shift historically moves totals markets by a quarter to half a point.
Integration with Line Movement Monitoring
Betting operators and syndicates incorporate venue-specific climate layers into their pricing algorithms, adjusting totals and player props when on-site data diverges from public forecasts by defined thresholds. A sudden drop in cross-field wind speed at a coastal stadium, for example, has preceded over-performance in kicker props during afternoon contests, prompting line adjustments within the first quarter. Those who study these relationships track sharp-money timing against climate anomalies to identify when early lines fail to account for localized conditions that emerge closer to game time. Canadian meteorological services and the Australian Bureau of Meteorology provide public datasets that analysts combine with league play-by-play records to back-test these correlations across multiple seasons.
Case Examples from Recent Seasons
One Pacific Northwest baseball park demonstrates consistent evening marine-layer intrusion that lowers effective temperatures and suppresses extra-base hits after the seventh inning, and line totals have moved downward an average of 0.6 runs once sensors confirm the layer's arrival. In European soccer, a riverside venue experiences trapped humidity that increases stoppage time due to player cramping, and totals markets have responded with upward adjustments when pre-game humidity exceeds seasonal norms by more than eight percent. Observers note that these patterns repeat across home stands but vary when the same teams play at neutral sites lacking identical microclimate features.
Conclusion
Venue microclimate charting supplies an additional data stream that connects environmental measurements directly to observed line shifts in outdoor league contests. Continued expansion of sensor networks and integration with public meteorological sources from varied regions supports more precise quantification of these effects, allowing models to refine expectations for scoring and performance variables that influence market pricing.