Weather-Driven Line Shifts: Spotting Discrepancies in Totals Markets via Forecast Integration
Gisela Lange · May 29, 2026
Weather-Driven Line Shifts: Spotting Discrepancies in Totals Markets via Forecast Integration
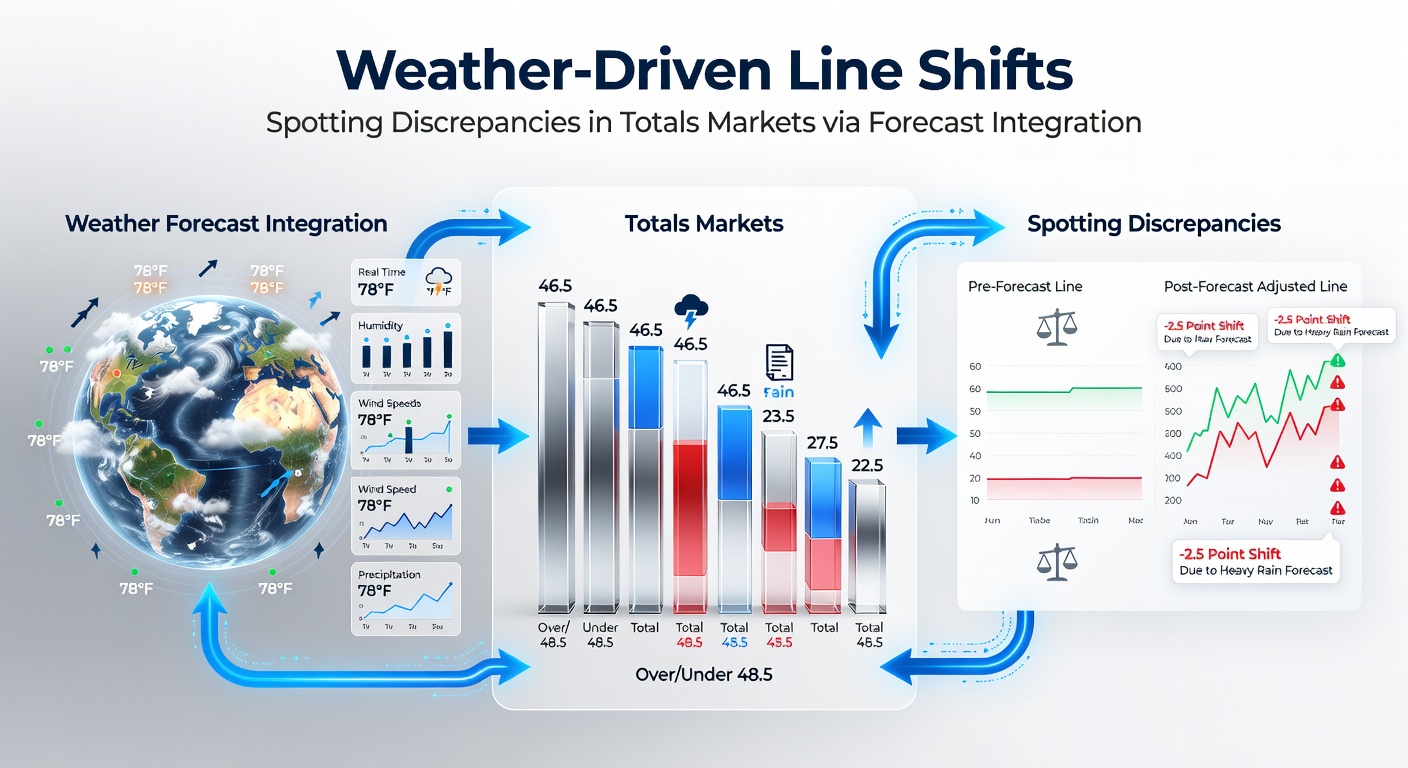
Weather patterns exert measurable pressure on totals markets across major sports leagues, where forecasters track variables such as wind speed, precipitation, temperature gradients, and humidity levels that directly alter scoring probabilities. Bookmakers adjust lines in response to incoming data, yet integration of high-resolution forecast models often reveals temporary discrepancies that arise when public betting volume lags behind meteorological updates.
Core Mechanisms Linking Weather to Scoring Totals
Research from atmospheric science groups shows that sustained winds above 12 mph reduce home-run rates in baseball by 8 to 12 percent at certain ballparks, while similar conditions in American football suppress passing yardage by limiting quarterback accuracy and increasing interception risk. Temperature drops below 40 degrees Fahrenheit correlate with lower point totals in outdoor NFL games because ball carriers lose grip and receivers struggle with route timing, according to datasets compiled by the National Oceanic and Atmospheric Administration.
Precipitation intensity further modifies totals because heavy rain increases fumble rates and forces conservative play-calling in both college and professional contests. Humidity levels above 70 percent have been shown to accelerate fatigue in soccer matches, producing fewer goals after the 70-minute mark when combined with temperatures exceeding 85 degrees.
Forecast Integration Techniques Used by Analysts
Modern forecast integration relies on ensemble models that blend outputs from multiple meteorological agencies rather than single-source predictions. Analysts cross-reference hourly updates from the European Centre for Medium-Range Weather Forecasts with localized radar feeds to refine expected scoring environments 24 to 48 hours before kickoff. When ensemble spreads narrow around a specific wind vector or rainfall window, line movement in totals markets frequently trails the refined probability estimates by several hours.

Those who monitor model consensus note that discrepancies widen most often during transitional weather systems, such as approaching cold fronts or coastal sea-breeze shifts. In May 2026, early-season MLB series along the Gulf Coast produced repeated examples where initial totals opened at 8.5 runs yet closed at 7.5 after forecasters locked in sustained 15 mph onshore winds for evening games.
League-Specific Patterns and Historical Data
Baseball exhibits the clearest weather-driven line shifts because park dimensions interact directly with wind direction and temperature. Data compiled by academic researchers at the University of Illinois indicates that games played at Coors Field show totals inflated by an average of 1.3 runs when daytime temperatures exceed 85 degrees and humidity falls below 30 percent. Conversely, games at Oracle Park see totals suppressed when marine-layer fog rolls in during the sixth inning or later.
Football markets respond more to sustained precipitation than to temperature alone. Studies published by the Meteorological Service of Canada document a 14 percent reduction in combined team scoring during games with rainfall rates above 5 millimeters per hour. Bettors who overlay radar-derived precipitation nowcasts against opening totals have identified edges when lines remain static after official forecasts upgrade rainfall probabilities from 30 to 70 percent.
Practical Steps for Discrepancy Detection
Observers track the interval between forecast revision timestamps and subsequent line adjustments at multiple sportsbooks. When a National Weather Service update revises wind gust projections upward by 5 mph yet totals remain unchanged for more than 90 minutes, the lag creates a measurable window. Analysts then compare implied probabilities from the stale line against revised run or point expectancy models that incorporate the updated parameters.
Cross-referencing multiple forecast sources reduces false signals that arise from single-model errors. European and North American agencies often diverge on boundary-layer moisture forecasts, so consensus thresholds above 80 percent agreement serve as a filter before traders act on totals discrepancies.
Conclusion
Integration of granular weather forecasts into totals-market analysis continues to evolve as model resolution improves and data latency decreases. Those monitoring line movement against meteorological consensus have documented repeatable timing gaps that appear across baseball, football, and soccer schedules. Continued refinement of ensemble techniques and real-time radar feeds supplies additional data points for identifying when published totals diverge from current atmospheric conditions.